What is ResView?
ResView is a tool for visualizing the PBFT process in Resilient DB. ResView is built on top of Resilient DB and gathers statistics from transactions to display in graphical form. ResView works on all transactions performed with local instances of Resilient DB, whether sent from ResView, another application, or in the ResilientDB terminal. Our goal for ResView is to enable greater understanding of the ResilientDB backend by people who want to learn more about how the PBFT consensus protocol works and the general flow of blockchain consensus, as well as developers who want to observe the status of ResilientDB and test their own applications/changes on the ResilientDB framework.
Below is a diagram showing the workflow of ResView and the high-level structure:
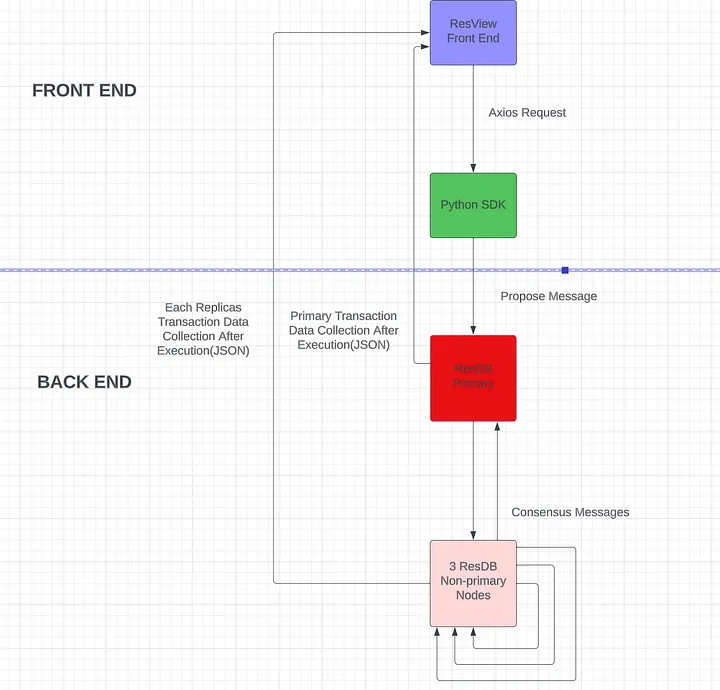
Figure 1. Diagram displaying the structure of ResView and how data is passed between the different services.
The diagram can be broken down as follows. An application sends a transaction to the GraphQL server, which parses the request and transforms it into a usable Request for ResilientDB. The GraphQL server then forwards this request to the ResilientDB instance, which performs the consensus protocol on the request then executes the request contents. During the process of inter-replica communication, data about the consensus protocol is collected. Once the transaction is completed, the ResilientDB service sends the consensus data along a websocket connected to ResView, which then collects and stores this data. Once ResView acquires the consensus data, ResView transforms and leverages it to create various diagrams which show what happened in the consensus process to the user.
Interfacing with ResilientDB
ResView offers both ways to interact with the ResilientDB architecture, as well as ways to visualize what is occurring in ResilientDB. Users are able to interact with ResilientDB through the application using the transaction forms and “make a replica faulty” buttons. Within the transaction forms, users input the data fields for the transaction they wish to send and press either set or get. Once this transaction is confirmed, it is sent via Axios to the sdk, which verifies the transaction and forwards it to the ReslientDB backend, where it is then processed and executed.
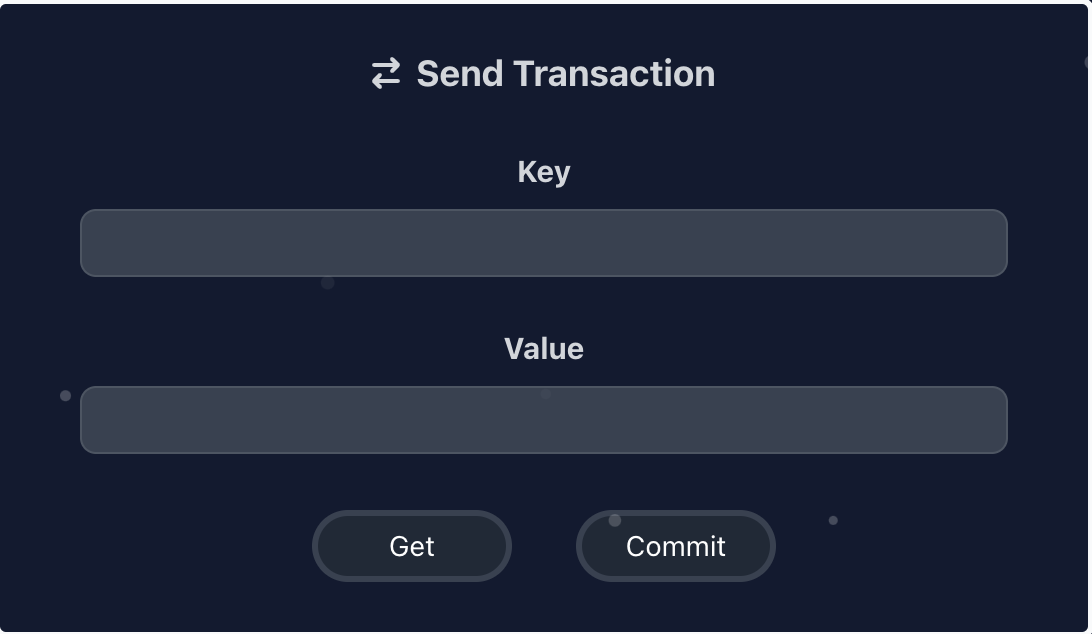
Figure 2. Image of the Transaction Form.
For the faulty buttons, when these are pressed, they send a signal to the corresponding the replica informing it to reject any transactions it receives, simulating a replica unable to receive messages. Before this addition, there was no method of forcing a replica to be faulty, making this a valuable addition for testing various cases and potential situations ResilientDB could face.
Data Collection
ResView collects the data for visualization directly from the ResilientDB application, as while transactions are being ran, a statistics data structure collects the contents of the transaction, timestamps of when each state was reached, and timestamps of when messages were received. These statistics are then grouped as a JSON, which is then sent out to the front end application. The reason the data is collected this way is to enable ResView to produce visualizations even without access to log files, as well as gather information regardless of who initiated the transaction.
Viewing the Data
On the application, users are able to select which transaction’s data they want to see diagrams of, as all data is stored as a history while the application is running. Once a transaction is selected, there are 3 viewable graphs: PBFT diagram, prepare messages vs time, and commit messages vs time. In order to select a transaction, it can be chosen from the list of performed transactions in the transaction table.
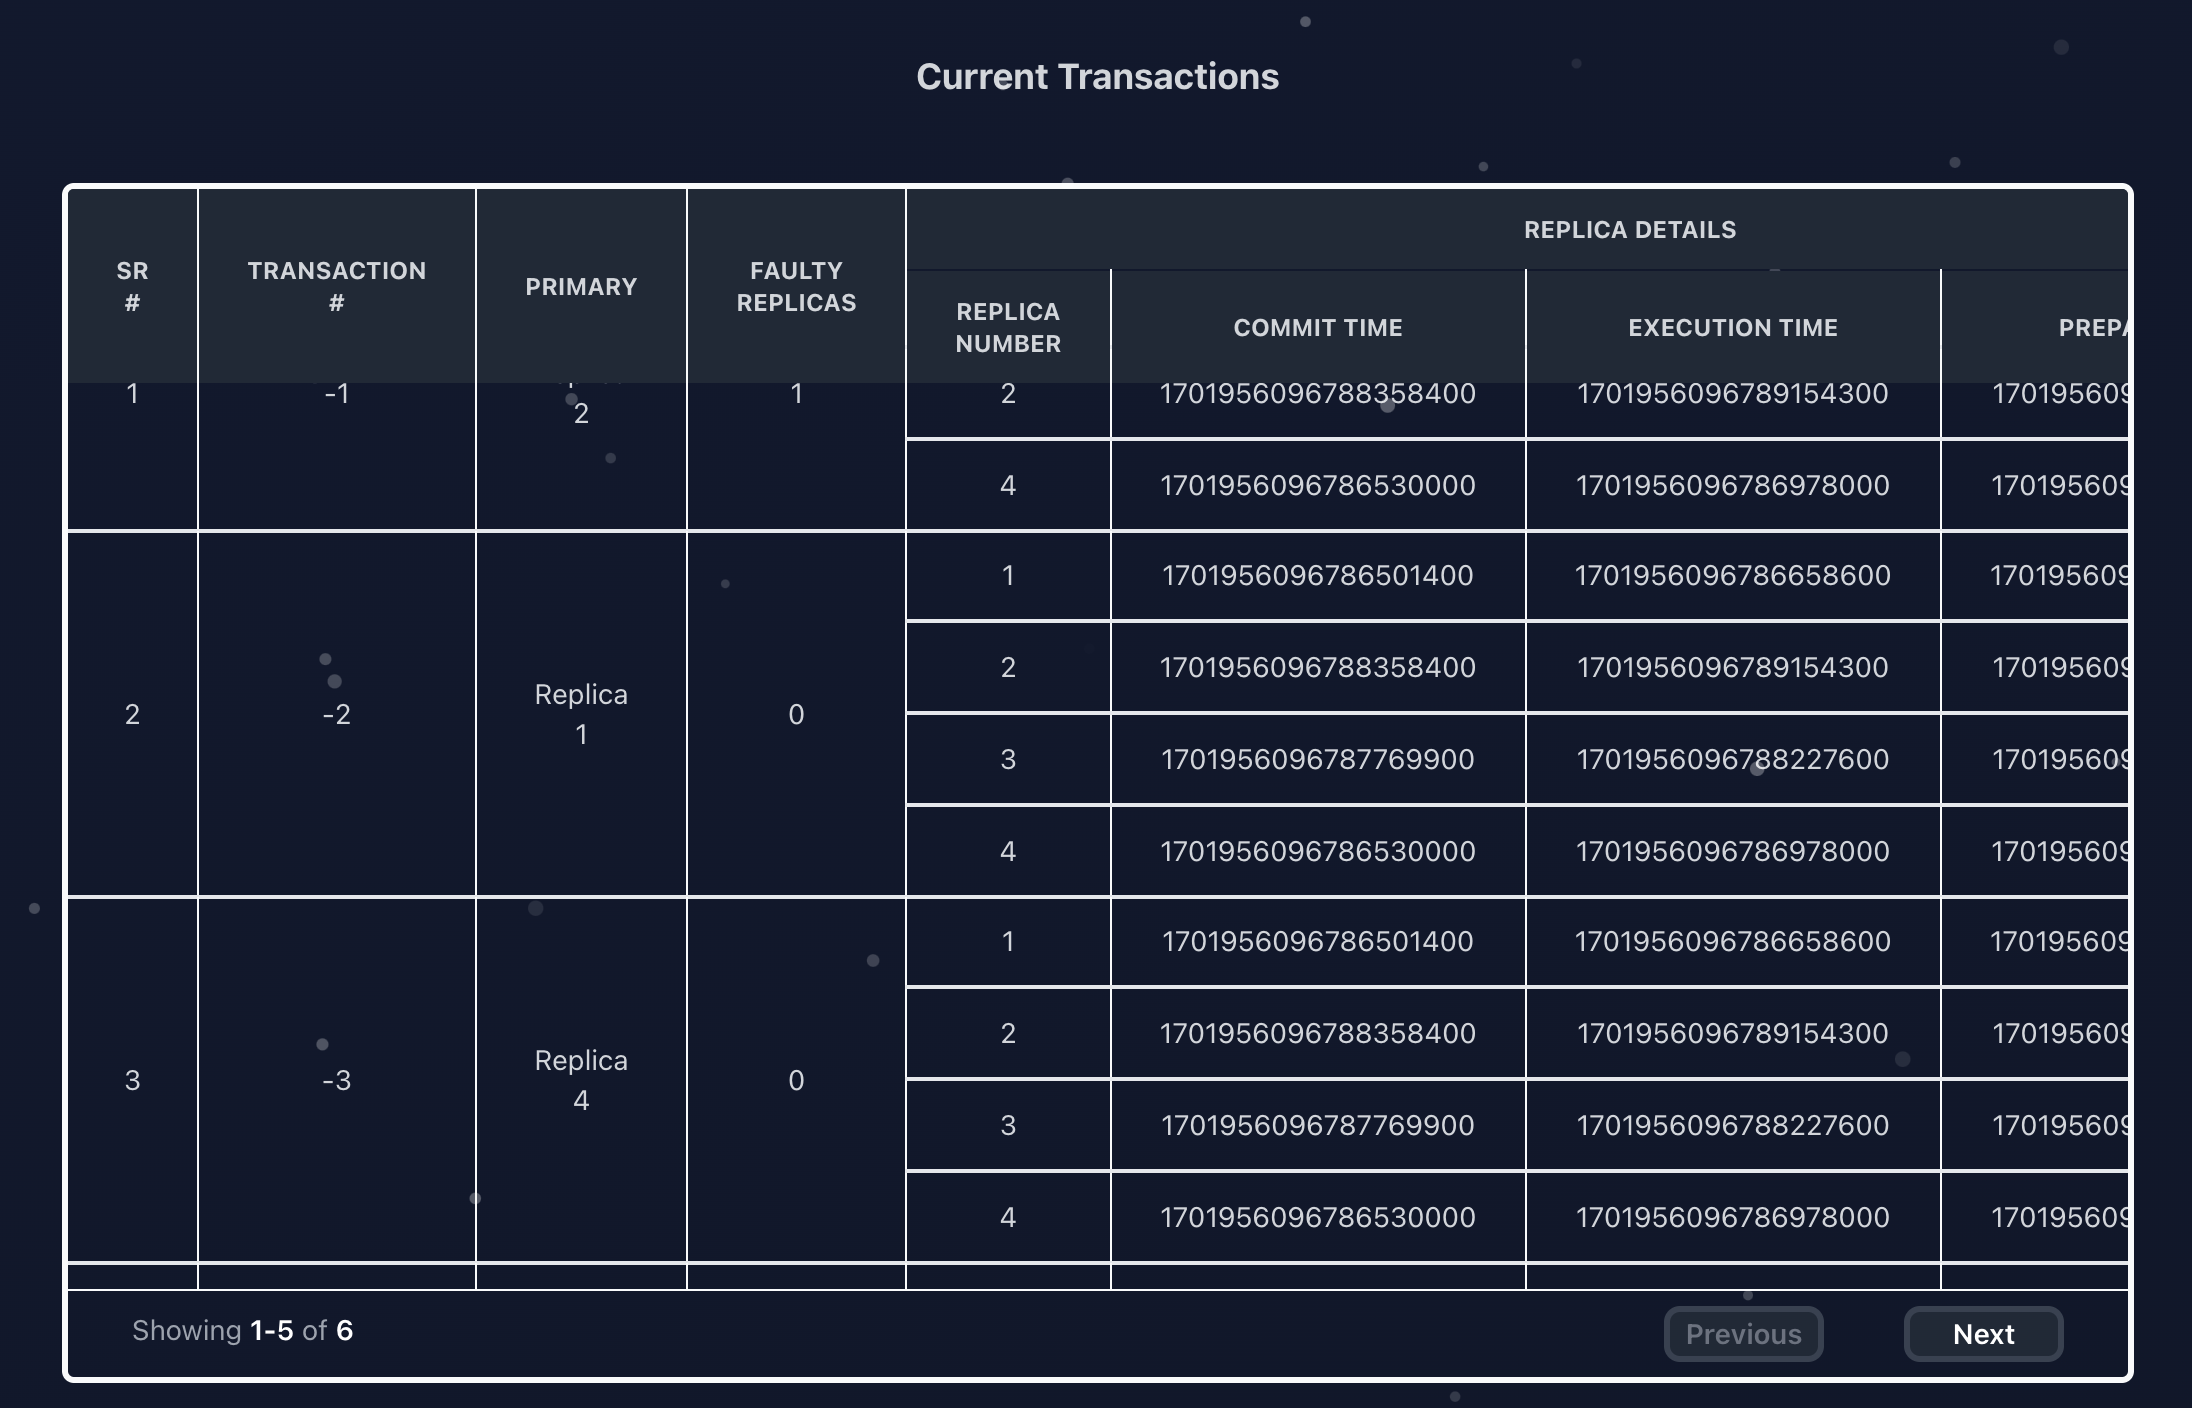
Figure 3. Transaction Table.
The PBFT diagram is dynamically constructed using the data collected from the replicas. The main data points utilized are the primary id, which signifies in the diagram where the client should send its request to, the timestamps of each state, as they identify that the replica reached that state and how long it took, and the existence of each replica’s data, as faulty replicas do not send their data to the front end. This allows the PBFT diagram to work with real time data and accurately convey the state of ResilientDB to the user, as well as the flow of the consensus protocol.
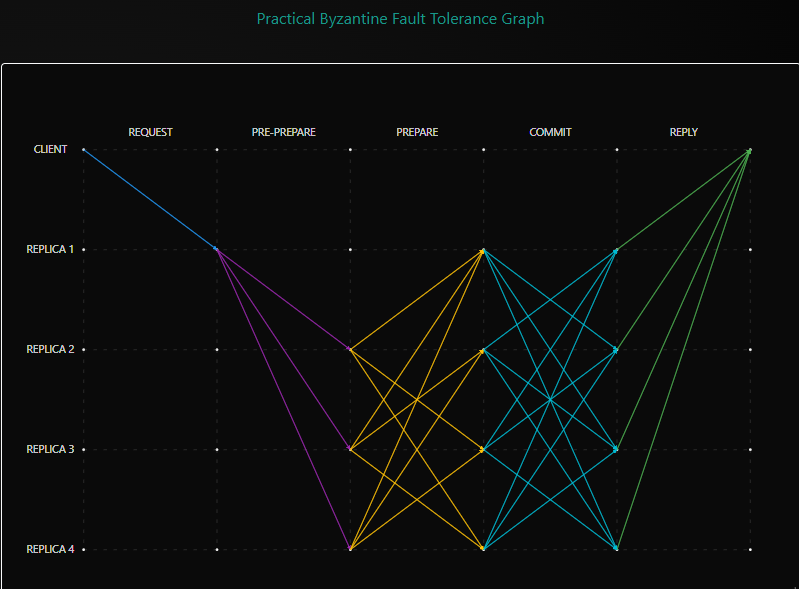
Figure 4. PBFT Diagram.
Both the prepare message vs time and commit message vs time graphs use a line graph containing a line of each replica’s message collection. The timestamps start from when a replica is first able to start sending messages, which the message collection times are relative to. The purpose of displaying lines from each replica is to easily compare the rates at which replicas collected messages to understand the relationship between them, as well as identify any potential issues with message collection. In order to focus on specific replicas, the user is also able to toggle the lines of any replica which reduces the amount of data of the graph being displayed.
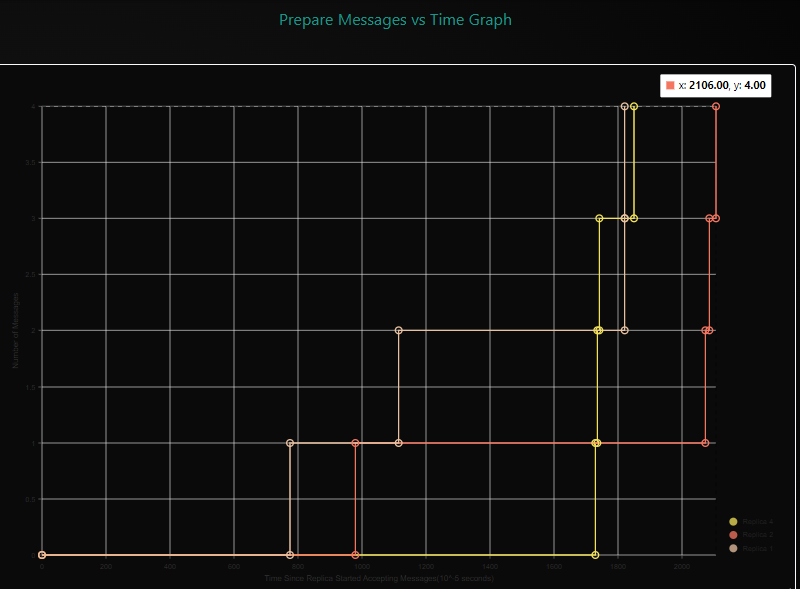
Figure 5. Commit Message Graph.
The status of each of the replicas is also visible on the side of the application, showing which replicas are non-faulty and which are either faulty or unavailable. Previously, in order to tell which replicas were down, users had to go into the log file and see which replicas were not being updated actively or processing requests, but now users can easily see which replicas are available while sending transactions.
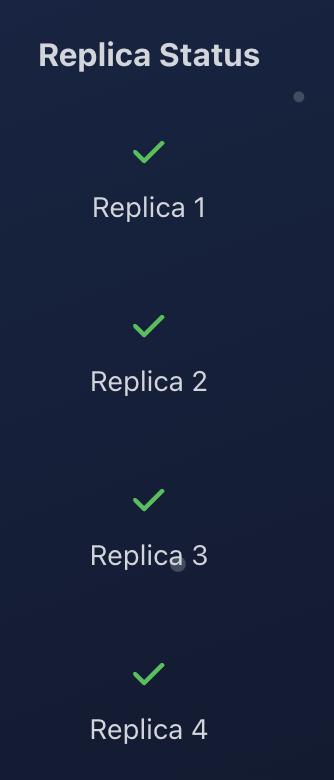
Figure 6. Replica Availability Status.
Demo Video
Running the Application
Prerequisites
Before running the ResView application, you need to start kv service on the ResDB backend and the sdk.
resilientdb
Git clone the ResView backend repository and follow the instructions to set it up:
git clone https://github.com/apache/incubator-resilientdb
Setup KV Service:
./service/tools/kv/server_tools/start_kv_service.sh
sdk
Git clone the GraphQL Repository and follow the instructions on the ReadMe to set it up:
Install GraphQL:
git clone https://github.com/ResilientApp/ResilientDB-GraphQL
Setup SDK:
bazel build service/http_server:crow_service_main

bazel-bin/service/http_server/crow_service_main service/tools/config/interface/client.config service/http_server/server_config.config
With these 2 services running, the ResView front end can now send transactions to the ResDB framework
Running the ResView Application
Clone the repo and open in a new folder.
npm install
Run the below code to start the app and load the script.
npm start
Using the ResView Application
Once ResView has been started, go to http://localhost:3000/pages/visualizer or https://resview.resilientdb.com/
Load KV_Service on resilient db once on the visualizer page, the web sockets should connect and log the “OPEN” message into the console 4 times.
Once on the visualizer page, send a transaction using the transaction form. Once the transaction’s data has been sent back, click on the various graphs to view the transaction data in a more comprehensive way. In order to select previous transactions, go to the transaction table and choose the specific transaction. In order to test different edge cases, set various replicas to faulty or not faulty and observe how the messages are now sent between replicas.
Future Work
Set up ResView on Cloud Instance to retrieve far more transaction data
Source Code Repositories:
https://github.com/ResilientApp/ResView
https://github.com/apache/incubator-resilientdb
https://github.com/ResilientApp/ResilientDB-GraphQL
Slides:
https://www.canva.com/design/DAGSGOyLh8g/pEC_FJgR6B_7RldsQBMrKQ/edit?utm_content=DAGSGOyLh8g&utm_campaign=designshare&utm_medium=link2&utm_source=sharebutton
Contributions:
Saipranav: Designed project architecture and workflow, feature ideas, coded the backend data collection, faulty replica toggles, configured all websockets, wrote JSON data parsing code, created Message vs Time graphs and line toggles, created sample transactions, setup all APIs, and added transaction sending and sdk incorporation.
Aunsh: Designed the front end UI/UX and architecture, skeleton, contexts, and pages, developed main PBFT diagram, setup graph component skeletons and general styling, look and functionality of the entire application. Also worked on adding tables, the home page, and seamless transition to viewing earlier transactions.