During the early stage of development, it is often convenient to target a specific NexRes metric with an all-in-one metric visualization tool. This is easily achieved with the NexRes Dynamic Dashboard (NDD), which abstracts status metrics from NexRes and is presented by Grafana and Prometheus combination. In this post, I will go through how NDD has been designed, what the NDD pipeline looks like, and what is the future of NDD. So, let’s get started it!
Pain Points
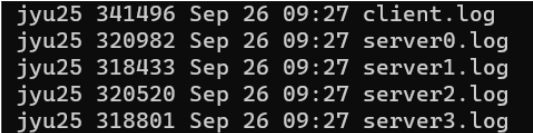
Before NDD was developed, NexRes developers could only access status metrics by the log file. Since the current NexRes uses four replica nodes and one client node, the developer needs to open up 5 log files together to monitor the status of NexRes. In addition, log files are static, which means it is not loading in real time. These pain points dramatically reduce the development performance and easily lead to human error. As for all the issues mentioned above, we need a tool to visualize NexRes metrics for better development.
NexRes Dynamic Dashboard Pipeline
NexRes Dynamic Dashboard is our solution. NDD is a Grafana base dashboard for Nexres. It aims to provide a simple real-time interface for developers to monitor and diagnose Nexres. The data metrics is stored in the Prometheus time-series database and queried by Grafana using PromeQL. The system usage data is provided by Prometheus third-party exporter Node Exporter. Here is a simple pipeline archtecture image.
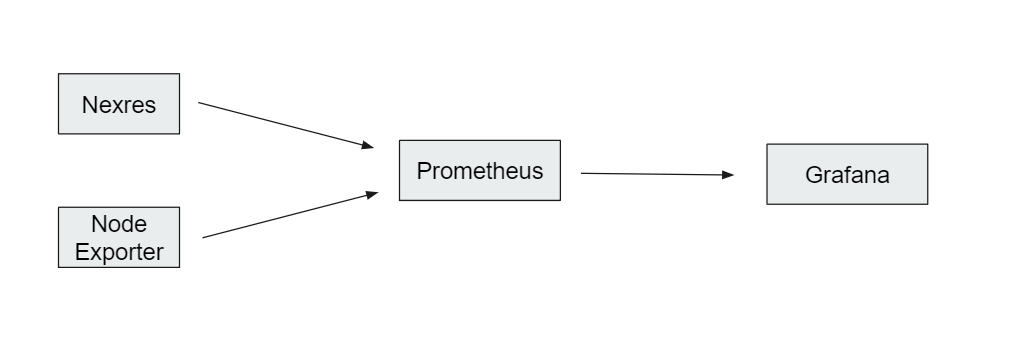
-
Prometheus is an open-source monitoring and alerting system that is widely used to monitor the performance of cloud-native applications. The Prometheus server collects metrics from the monitored applications and stores them in a time-series database, allowing users to query the data and create alerts based on specified conditions.
-
Grafana is an open-source platform for data visualization and monitoring. It allows users to create and share dashboards that display real-time data from various sources, such as Prometheus, InfluxDB, and Elasticsearch.
-
Prometheus-cpp is an open-source C++ library that provides an API for exposing and collecting metrics in a way that is compatible with Prometheus. It allows developers to instrument their C++ applications and servers with Prometheus-style metrics and to expose those metrics to Prometheus servers for collection and visualization.
-
Node Exporter is a standalone tool that provides an HTTP server that exposes Prometheus-compatible metrics about the host machine to be consumed by the Prometheus server. It runs as a daemon process on a host machine and collects a wide variety of metrics about the host’s hardware and operating system, including CPU and memory usage, disk and network I/O, and more.
Reason for choosing Prometheus
The reason we choose Prometehus is because it using pull mode to store the data. Pull mode refers to the way in which the Prometheus server fetches metrics from the targets it is monitoring. In pull mode, the Prometheus server periodically sends HTTP requests to a list of target URLs to scrape metrics from those targets.
With pull-based monitoring, the Prometheus server is in control of when and how often it gathers metrics from the targets it is monitoring. This allows for centralized control over the monitoring NexRes, and makes it easy to change the monitoring configuration for all targets at once.
Pull-based monitoring can scale more easily than push-based monitoring, as the Prometheus server is able to handle a large number of targets without being overwhelmed. As NexRes replica number can rapidly increase to above 100 nodes, this determation is base on future requirement.
The other reason for choosing prometheus is it support third parity exporter that able to show system status metrics and can be integrated to NexRes by using prometheus-cpp library.
NexRes and Prometheus
The Prometheus integration with your application is to use a third-party library called prometheus-cpp. This library provides a C++ client for Prometheus that can be used to instrument your application and expose metrics in the Prometheus format. As prometheus-cpp support bazel build tool, this made the integration even easilier since NexRes is also using bazel.
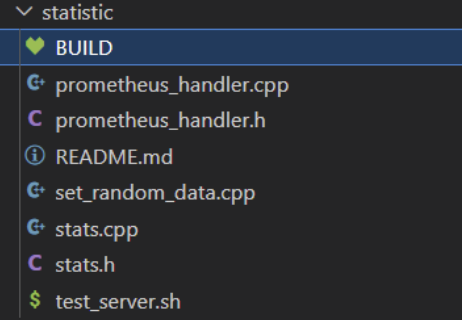
To allow Prometheus periodically collect the metrics from NexRes and store them in its time-series database, we developed “prometheus_handler” under statitics class to expose metrics in a format that Prometheus can scrape. Each replica is using different port for exposing their metrics, this allow Prometheus to collect all replicas data simultaneously.
Once the setup is finished, we need to connect Grafana to Prometheus for display NexRes metrics.
Grafana and Prometheus
Prometheus and Grafana are two popular tools used for monitoring and observability. Grafana is a visualization tool that can be used to create dashboards and graphs based on the data stored in Prometheus.
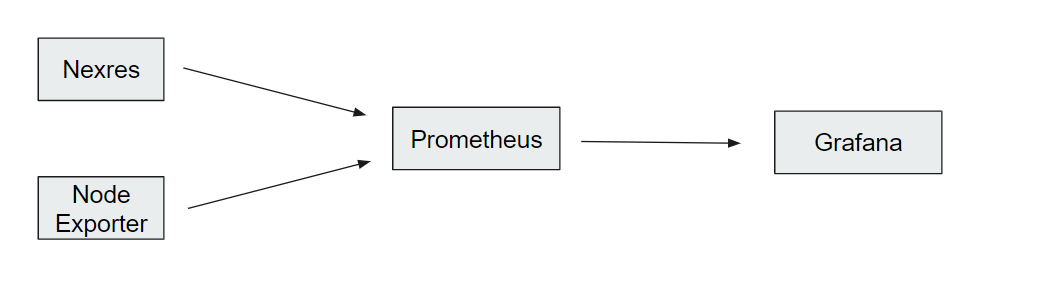
To use Prometheus and Grafana together, a common setup is to have Prometheus scraping metrics from various systems and then feeding that data into Grafana for visualization. This setup is often referred to as a “Prometheus-Grafana pipeline”. Here is the structure of this pipeline.
To create a Prometheus-Grafana pipeline, the first step is to install and configure Prometheus. This typically involves specifying the systems that Prometheus should scrape metrics from and setting up a storage backend for the collected metrics.
Once Prometheus is up and running, the next step is to install and configure Grafana. This involves setting up a data source that points to the Prometheus instance, as well as creating dashboards and graphs to visualize the data.
Once both Prometheus and Grafana are properly configured, they can be used together to monitor and visualize metrics from NexRes. Since all metrics should be properly collected if the NexRes and Prometheus has been connected. Developer can simply using PromQL in Grafana to query NexRes data and build the dashboard.
Please follow this blog to setup Grafana and Prometheus on your system.
Future Improvements
Support more time-series databases in NexRes
As the current phase of NexRes, the Prometheus time-series database is integrated. Since Grafana support various type of time-series databases, such as InfluxDB, OpenTSDB, Graphite, etc. To prevent unexpected things and be more user-friendly, we can develop an abstract layer in NexRes to support various databases. For example, there is “prometheus_handler” under the statistics class, we can have another class called “data_handler” and make “prometheus_handler” to be the subclass of “data_handler”. Following the same pattern, we can build “influx_handler”, and “graphite_handler” under this “data_handler” to support many time-series databases.
Introduce more performance numbers to the dashboard
Go though this google sheet, find out the metrics in TODO list that could introduce to NexRes.
Change embedded Grafana to HTTPs connection
Currently, the Grafana dashboard integrated in nesres.github.io is using http connection. This is a temporality solution that put http connection in https page is a not a secure method. We need to solve this problem in future interation.
Integrate dashboard into Nexres node manager
While Nexres Node Manager is finished, combine the functionality of cloud deployment installer with node manager.
Deploy Prometheus configuration by endpoint setup
This improvement also related to node manager. The current Prometheus configuration file only support 4 nexres replicas. If this number increase in the future, the configuration file and Grafana need to adject according to replica number.
Explore Grafana technique for better visualization
Introduce better visualization to Grafana dashboard.