What is the ResilientDB Blockchain Analyzer?
The ResilientDB Blockchain Analyzer offers a comprehensive visualization tool for transactions on the ResilientDB blockchain, similarly to Etherscan’s role for Ethereum. The two main features that the program offers are displaying all wallets connected to the ResilientDB blockchain, along with their respective transaction histories and offering a chronological visual representation of transactions, enabling easy tracking of transaction volume over time. It can also be used to help track the movement of illegally obtained funds or just to help see what transactions have been made on the blockchain. Currently the analyzer is already running live on the main instance of ResilientDB and can be viewed here.
Interfacing with ResilientDB
When the website is first accessed it will read the response from https://crow.resilientdb.com/v1/transactions and then save all of the transactions made on the blockchain as a single json file. The ResilientDB blockchain visualizer then displays transactions in the form of a tree. At the top of the tree will be a single node containing the original wallet ID and then below that will be nodes displaying all of the transactions made by that specific wallet ID. If you click on any of those transactions you can see all the subsequent transactions made by the recipient of the selected transaction. If no subsequent transaction had been made then the transaction will not show up as being clicked.
Data Collection
Data collection for homepage
If you run the python backend for the blockchain, then each time the webpage is accessed the flask script will download the blockchain’s json data and will store it under
./Finecharts/js/settings/transactions.json
This python backend and json file is necessary to make the graph on the homepage of the website display up to date data.
Data collection for tree.html
For tree.html the data is collected when the javascript code (tree.js) runs. This means that the data will be updated every time the page refreshed.
Viewing the Data
There are two graphs to display the data from the json file:
First we have a simple line griph that displays the transactions made within the last year with the month on the x-axis and the amount of transactions on the y-axis.
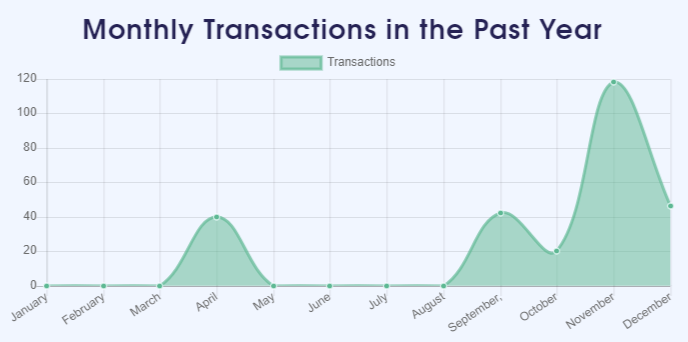
Figure 1. Image of the Transactions Graph.
The second way is the tree that was described above. You can track the transaction history coming from a single user’s wallet ID and follow the subsequent transactions.
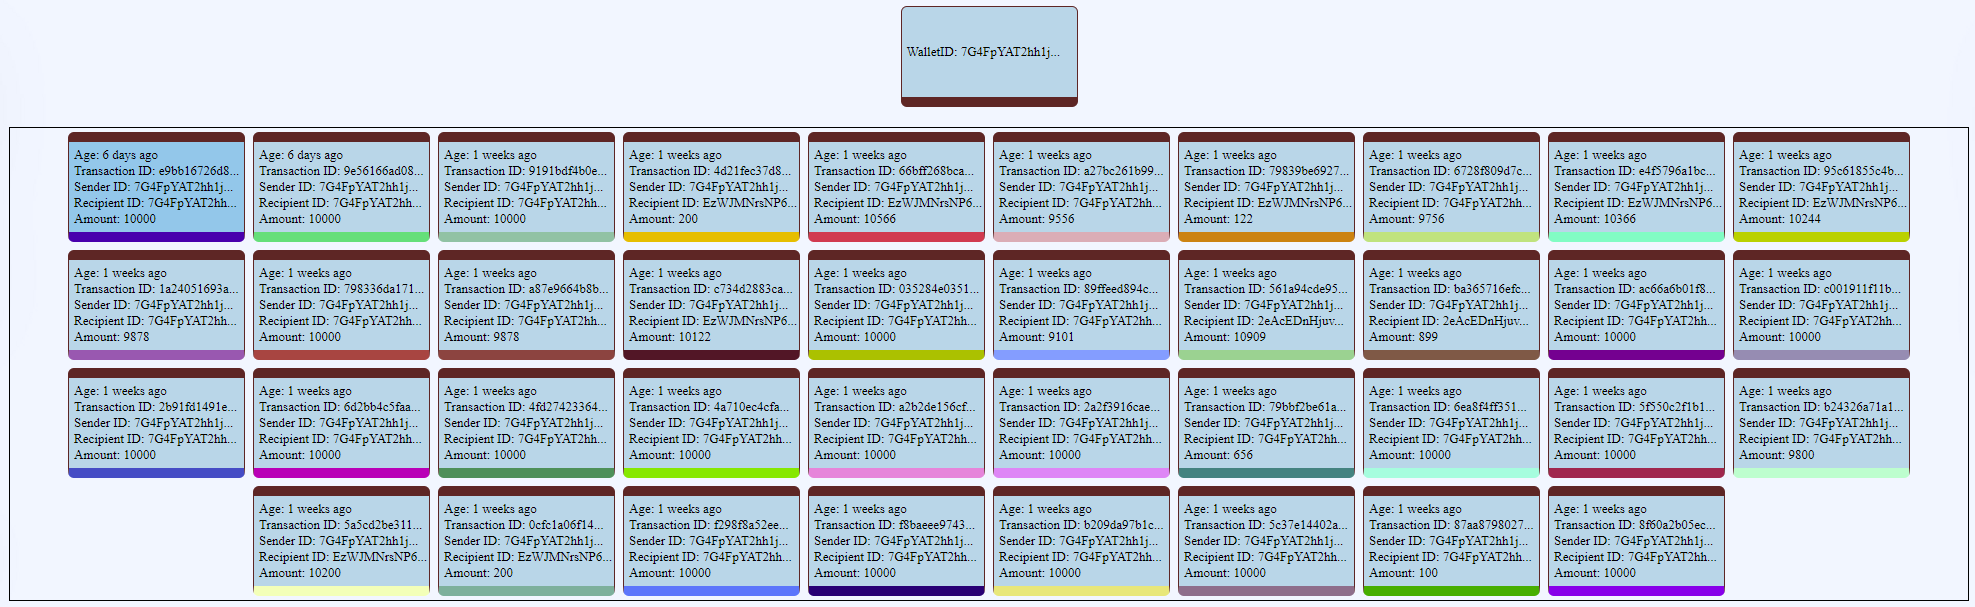
Figure 2. Image of the Tree of Transactions.
Demo Video
Running the Application
Prerequisites
Before running the ResilientDB Blockchain Analyzer website, you need to start kv service on the ResDB backend and the sdk. We chose to run this on Google Cloud but any cloud service will work. You also must ensure that the way your data is stored in the json follows this format:
{
    "id": "Transaction id",
    "version": version,
    "inputs": [
        0: {
            "owners_before": [
                0: "ID of Sender Wallet"
            ]
        }
    ]
    "outputs": [
        0: {
            "public_keys": [
                0: "ID of Reciever Waller"
            ]
            "amount": "Transaction Amount"
        }
    ]
    "operation": operation,
    "asset": {
        "data": {
            "timestamp": "Timestamp in epoch time"
        }
    }
}
If your json structure does not follow this format go to Setting up the website frontend
Setting up the python backend
First you need to install apache2 using:
sudo apt install apache2
You will also need to install gunicorn using:
sudo pip install gunicorn
Then navigate to where your index.html folder is located, for google cloud it is under:
/var/www/http/
And delete index.html if present (we will replace this with the new home page).
Git Clone the ResDB-Chain-Analyzer Repository into this folder:
sudo git clone https://github.com/Richard-Voragen/ResDB-Chain-Analyzer/tree/main/ResDB-Chain-Analyzer
Next we need to ensure that the proper url’s are set to retrieve the json data from:
Inside of the App.py file modify the fields.
IP_ADDRESS_TO_TRANSACTIONS = 'URL that contains json of transactions'
IP_ADDRESS_TO_HOSTING_SITE = 'URL/Domain Name of hosting site'
Finally we need to run the flask script that will update transactions.json when a user visits the website:
Run this command from /var/www/http/ResDB-Chain-Analyzer:
sudo gunicorn -w 4 -b 0.0.0.0 app:app
If any changes need to be made by the user to the app.py file then you must first end the gunicorn task with:
sudo pkill gunicorn
Setting up the website frontend
Within the directory /var/www/http/ResDB-Chain-Analyzer/js/tree.js change to field at the top from:
"https://crow.resilientdb.com/v1/transactions" to the URL that contains json of transactions
Changing the default json formatting
First open the Javascript file located at: Install GraphQL:
/js/jsonFormat.js
Then modify the field to return their desired outputs: Install GraphQL:
get_id(jsonObj) : return the id of the transaction
get_sender(jsonObj) : return the sender of the transaction
get_recipient(jsonObj) : return the recipient of the transaction
get_amount(jsonObj) : return the quantity of the transaction
get_time(jsonObj) : return the time of the transaction
Source Code Repositories:
https://github.com/Richard-Voragen/ResDB-Chain-Analyzer
https://github.com/ResilientApp/ResilientDB-GraphQL
Contributions:
Voragen: Designed chronological tree visualization of tree data and javascript background. Created main code for parsing and handling of the chain transaction history on the JSON file.
Fennen: Designed front end of webpage, created monthly graph on front page of website, and handled JSON parsing for data displayed on the monthly graph.
Allyn: Set up backend infrastructure and handled initial chain interactions.