What is MemLens?
MemLens is a comprehensive CPU and memory profiler designed for ResilientDB, offering granular, real-time performance insights through continuous profiling. By integrating advanced profiling tools and aggregating data from various system and process specific sources, MemLens provides a robust platform for database-specific metrics.
Our platform delivers detailed insights into the inner workings of the database, empowering users to optimize system performance effectively. Key metrics include cache hit ratios, storage and disk performance, CPU usage, call stack visualizations, dependency graphs, and more. The integration of continuous profiling ensures that performance trends and anomalies can be identified over time, enabling proactive optimization and system tuning.
MemLens represents an ambitious and evolving vision to bridge the gap between high-level performance monitoring and low-level system insights. We are proud to share a packaged version that highlights the potential of this innovative tool and are committed to ongoing improvements to push the boundaries of database profiling.
Key Highlights
-
Integrated Terminal Playground: Provides a seamless terminal-like interface for retrieving (
GET) and storing (SET) values directly within ResilientDB, enhancing ease of use for developers and operators. -
Real-Time Flame Graphs: Automatically generates detailed flame graphs for memory and CPU profiling, paired with in-depth call stack analysis for processes to identify bottlenecks and optimize performance.
- Custom LevelDB Metrics:
Incorporates Custom C++ hooks to expose critical LevelDB metrics not available by default, such as:
- Cache hit ratios.
- Storage engine metrics, including the number of SST tables and file counts at each level.
-
Interactive Web-Based Frontend: Features a user-friendly, web-based interface for exploring performance insights interactively, making profiling data accessible and actionable.
-
Unified Profiling Dashboard: Aggregates data from multiple profiling tools into a cohesive dashboard, offering a single, unified view of system performance.
- Optimized for Linux: Designed to be lightweight and highly efficient, ensuring minimal overhead and smooth operation on Linux-based systems.
Architecture
Below is a architecture diagram of MemLens:
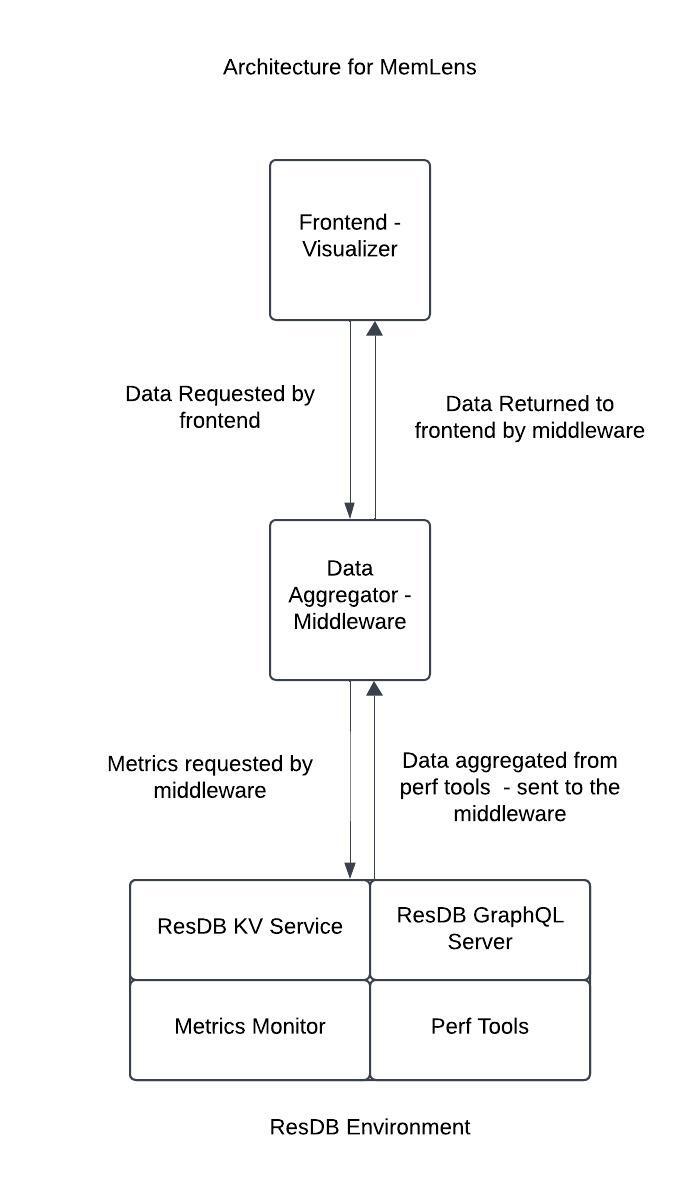
Figure 1. Diagram displaying the architecture of MemLens and how profiling metrics are collected.
The diagram can be broken down as follows. A client request for a particular metric is made by the client to the middleware. This layer acts as a data aggregation platform which collects metrics from the ResDB environment. The various data sources include time series data from node_exporter, call stack data from pyroscope, storage engine metrics from hooks integrated into ResDB’s CPP source code. ResDB Graphql service is also running to interface GET and SET API calls via HTTP requests.
Metrics
Call Stack Visualization
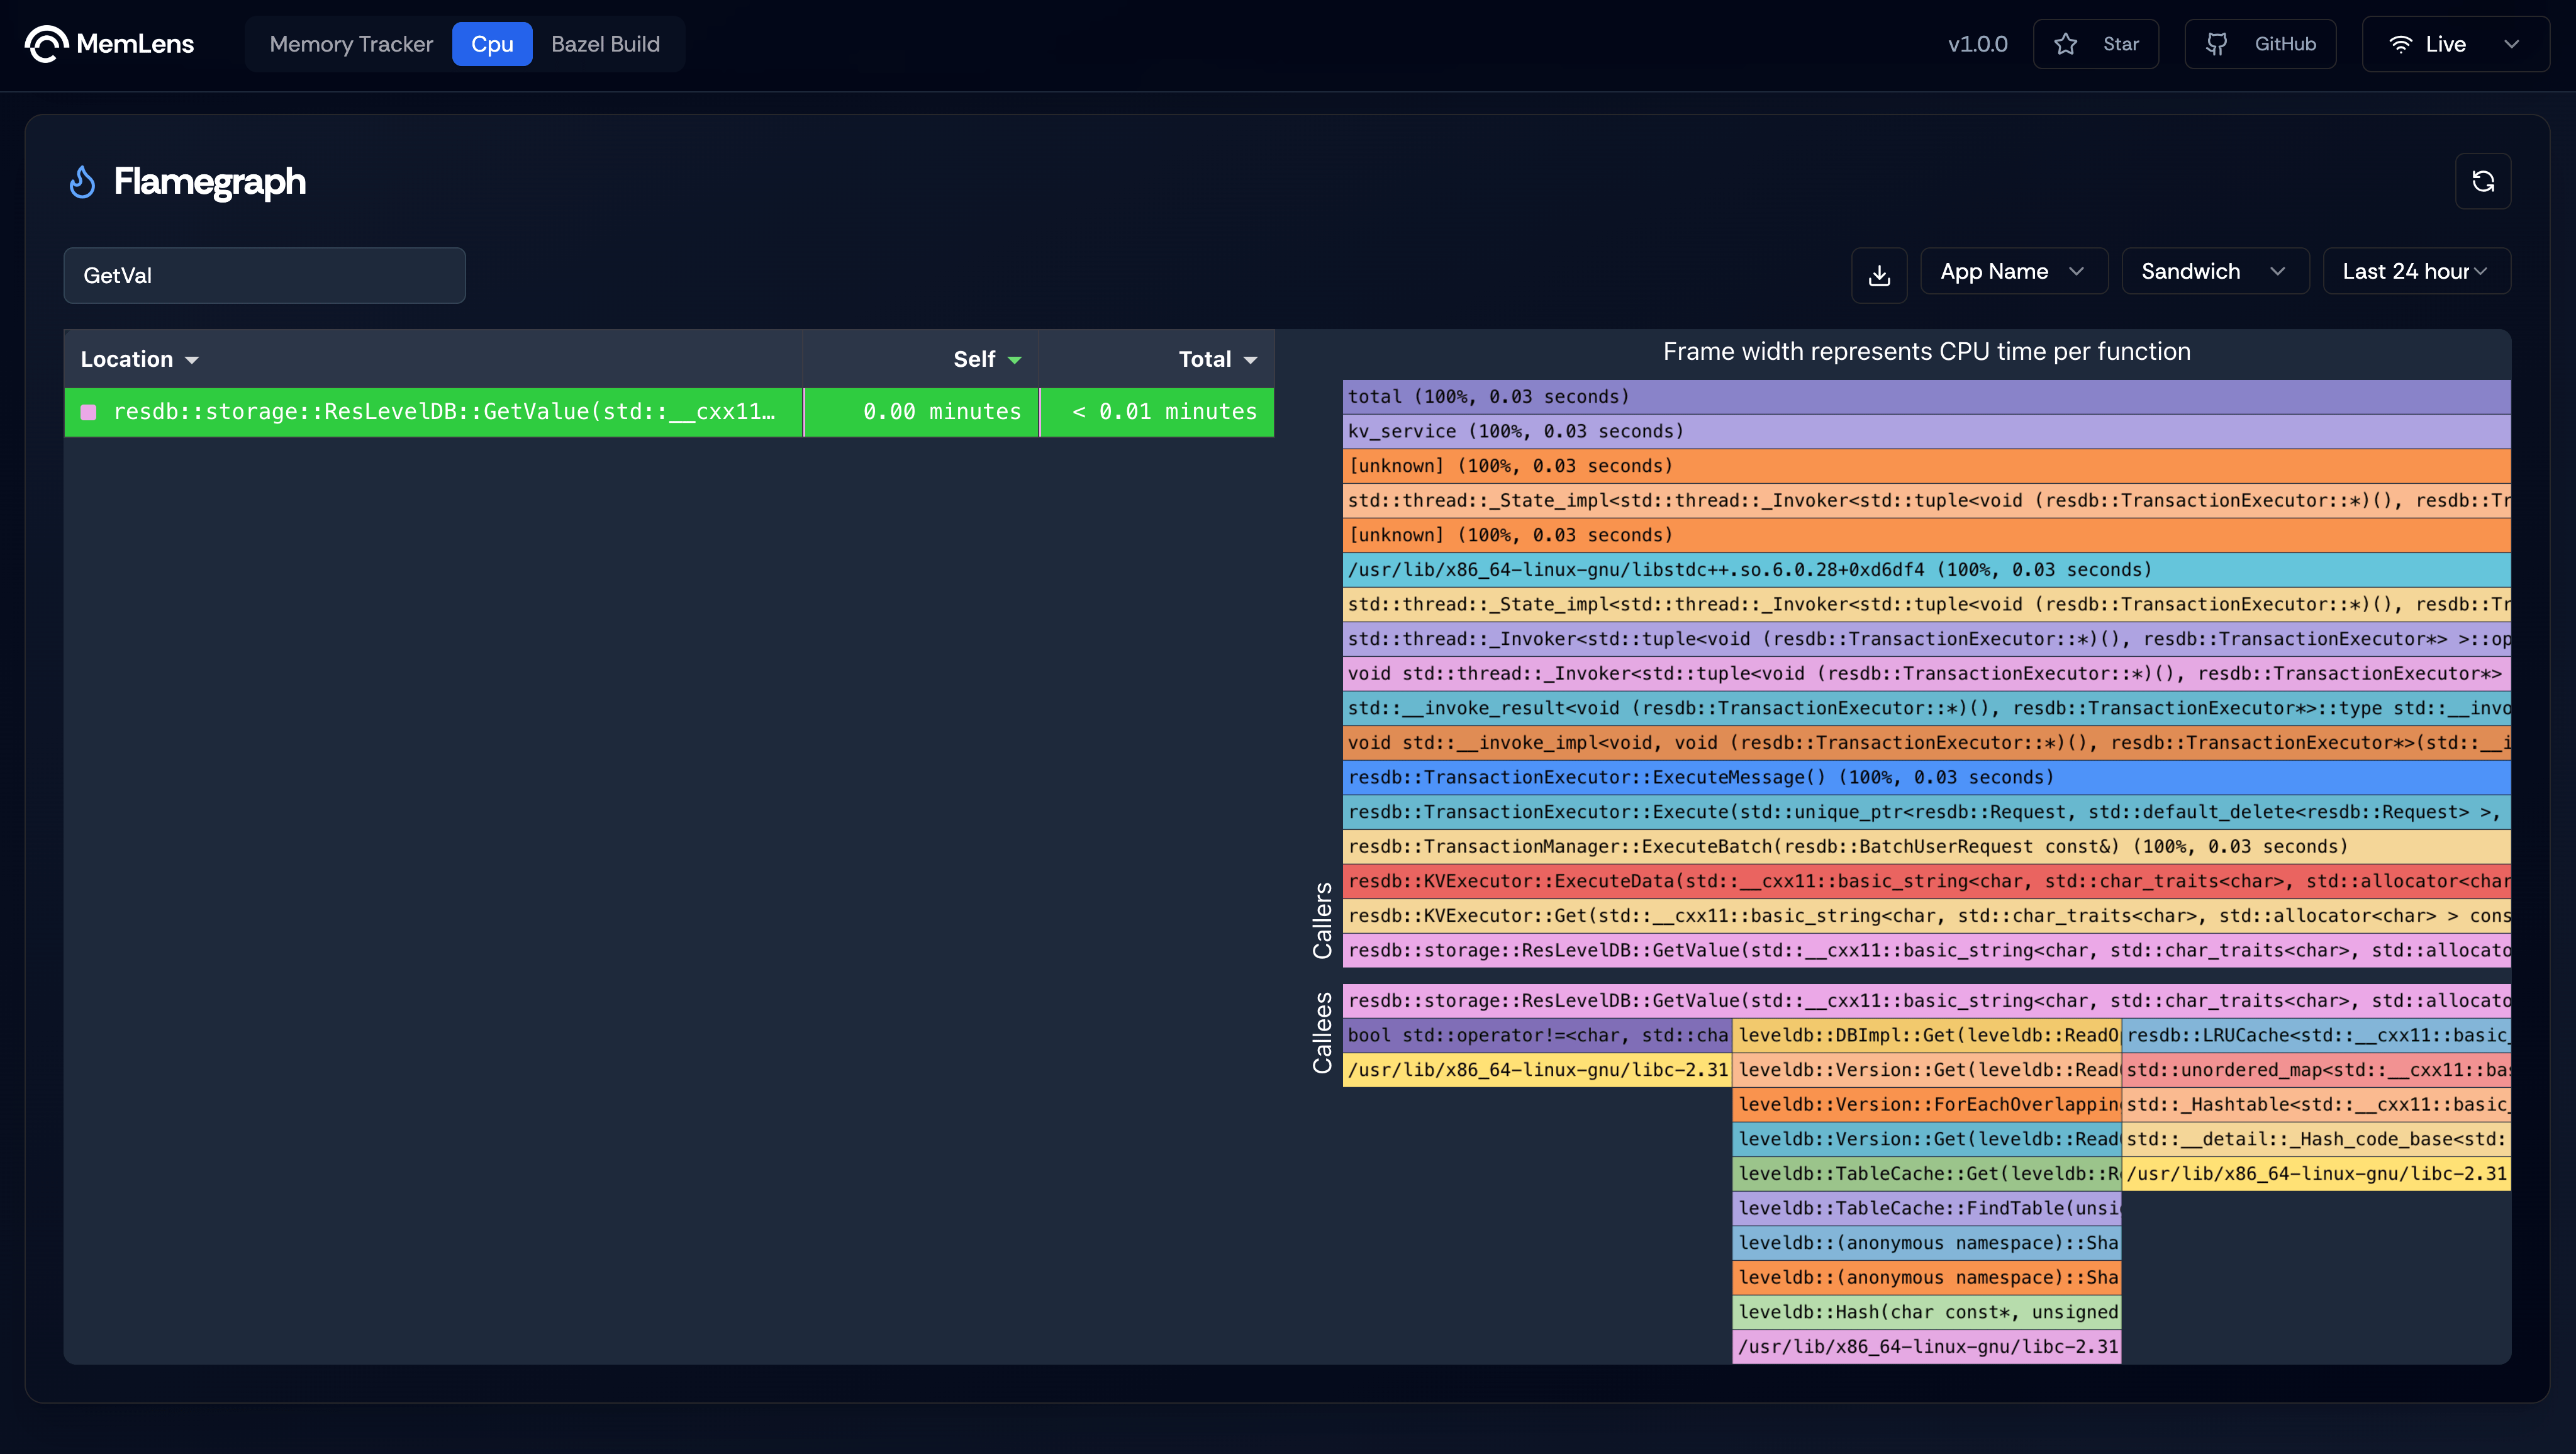
Figure 2. Flamegraph showing Call Stack when a transaction is retrieved
Flamegraph showing the call stack when a Get method is called on ResilientDB’s key value store. This graph shows the function caller which is invoked by the ResilientDB-GraphQL service and is serviced at the end by the storage engine which is LevelDB. The storage engine calls the in-memory LRU cache to check for cache hits and when not found calls its internal functions to retrieve the key value pair.
CPU Usage
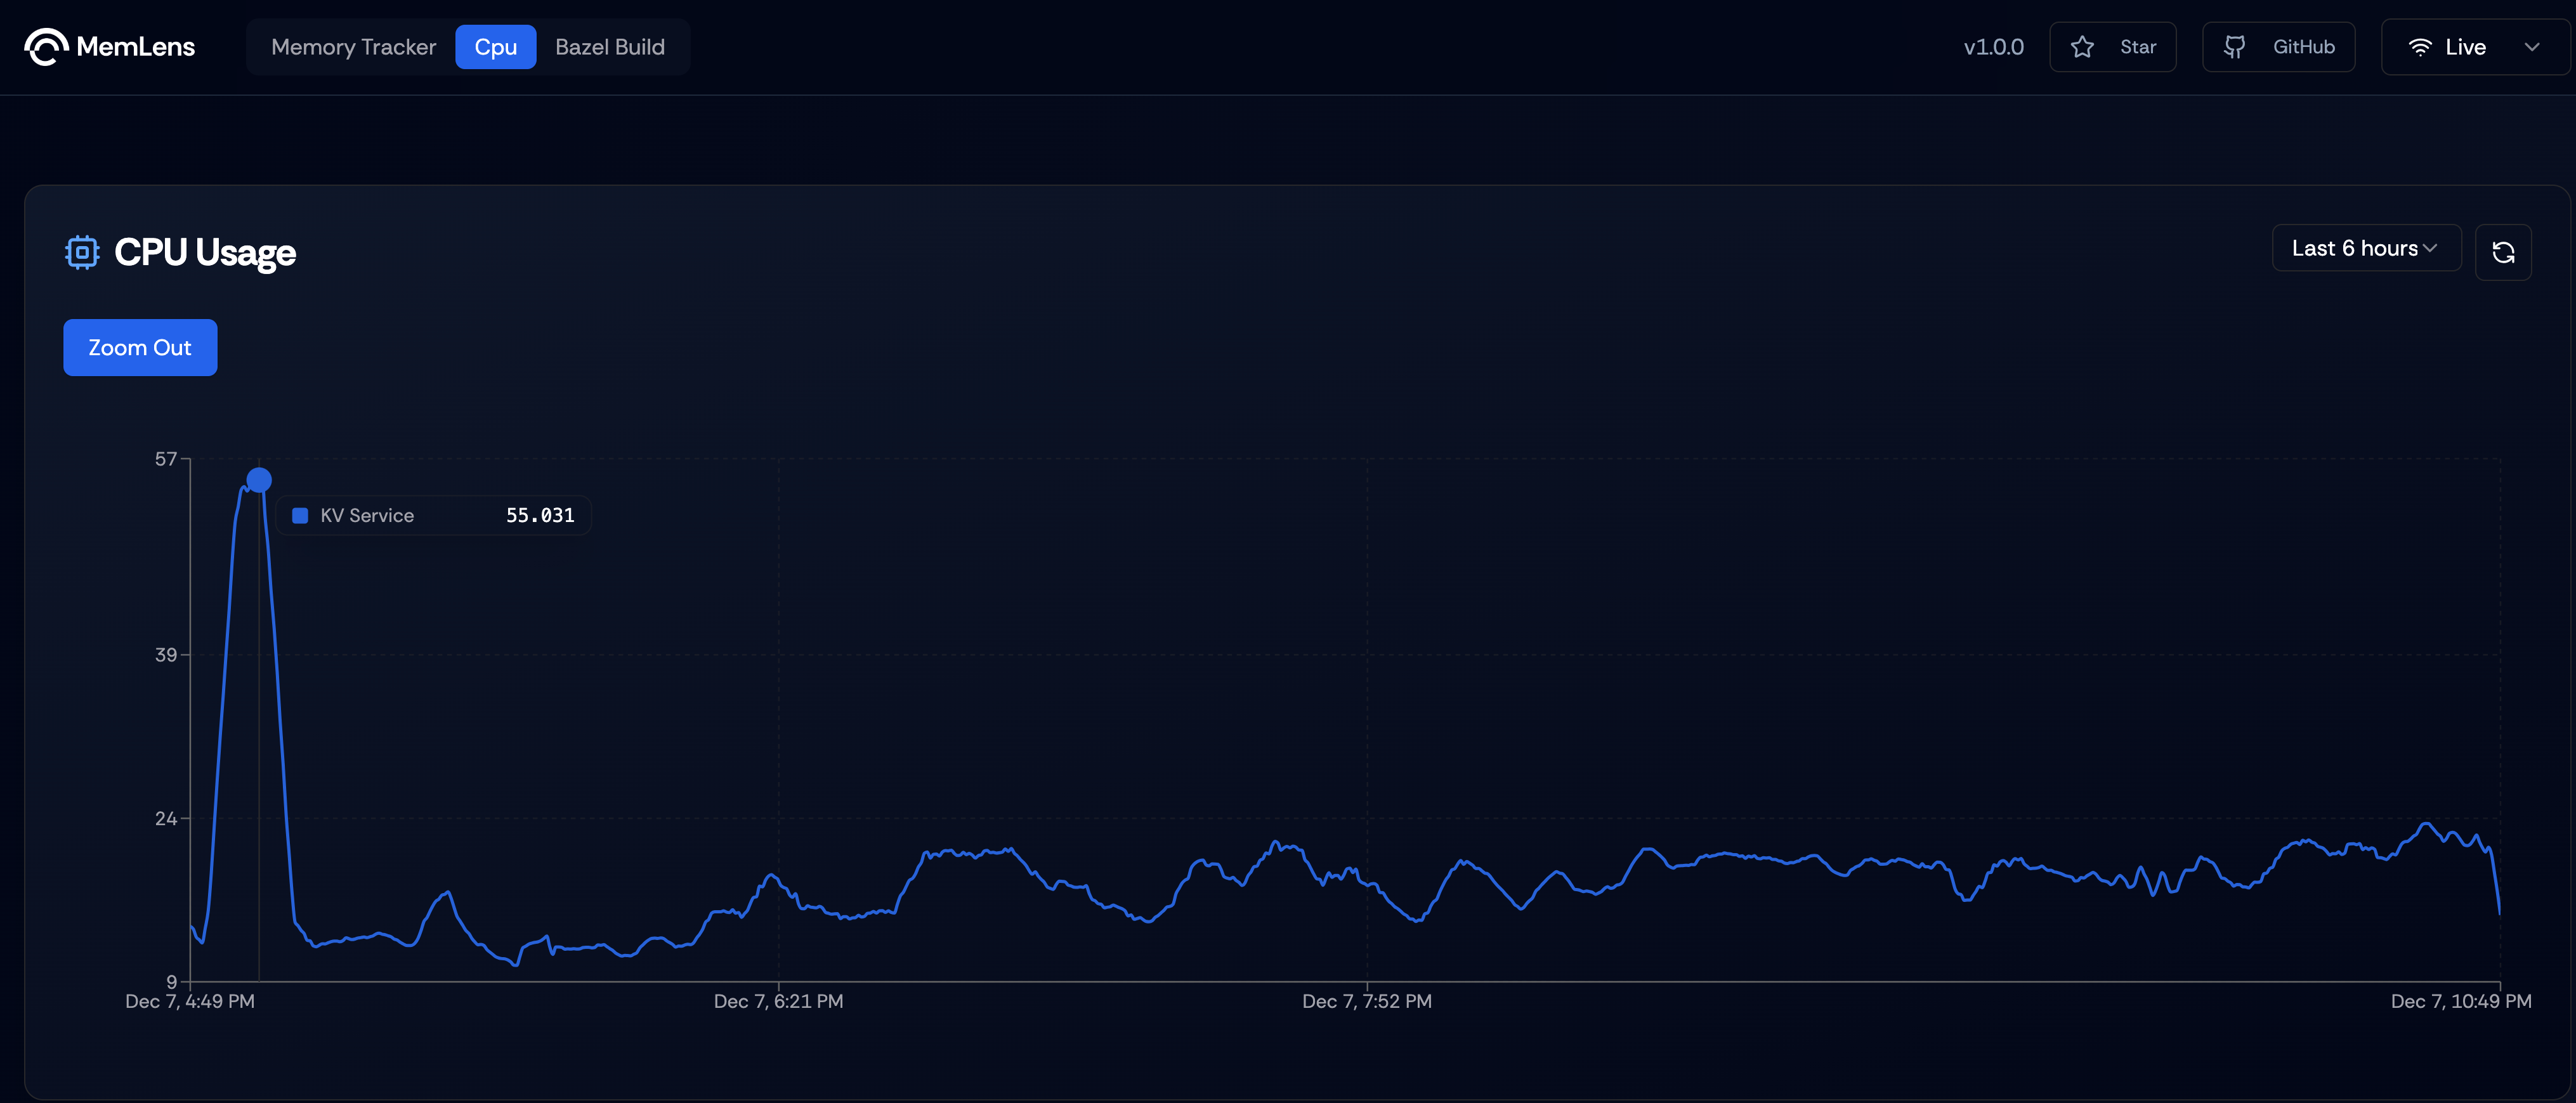
Figure 3. Line Graph showing showing CPU usage of ResDB KV Service over a period of 6 hours
Linegraph showing the CPU usage of ResDB’s KV Service over a period of 6 hours. This data is collected from process-exporter which is used to profile individual processes and export metrics through prometheus. We run process-exporter as systemd process to ensure persistent monitoring.
Storage Engine Metrics

Figure 4. Dashboard showing storage engine metrics.
Dashboard showing storage engine metrics, like cache hit ratio, approximate database size of leveldb, snapshot of process metrics like RSS, number of block reads and number of block writes. Each metric has a information tooltip which can be used to display more information about the metrics.
Disk Metrics
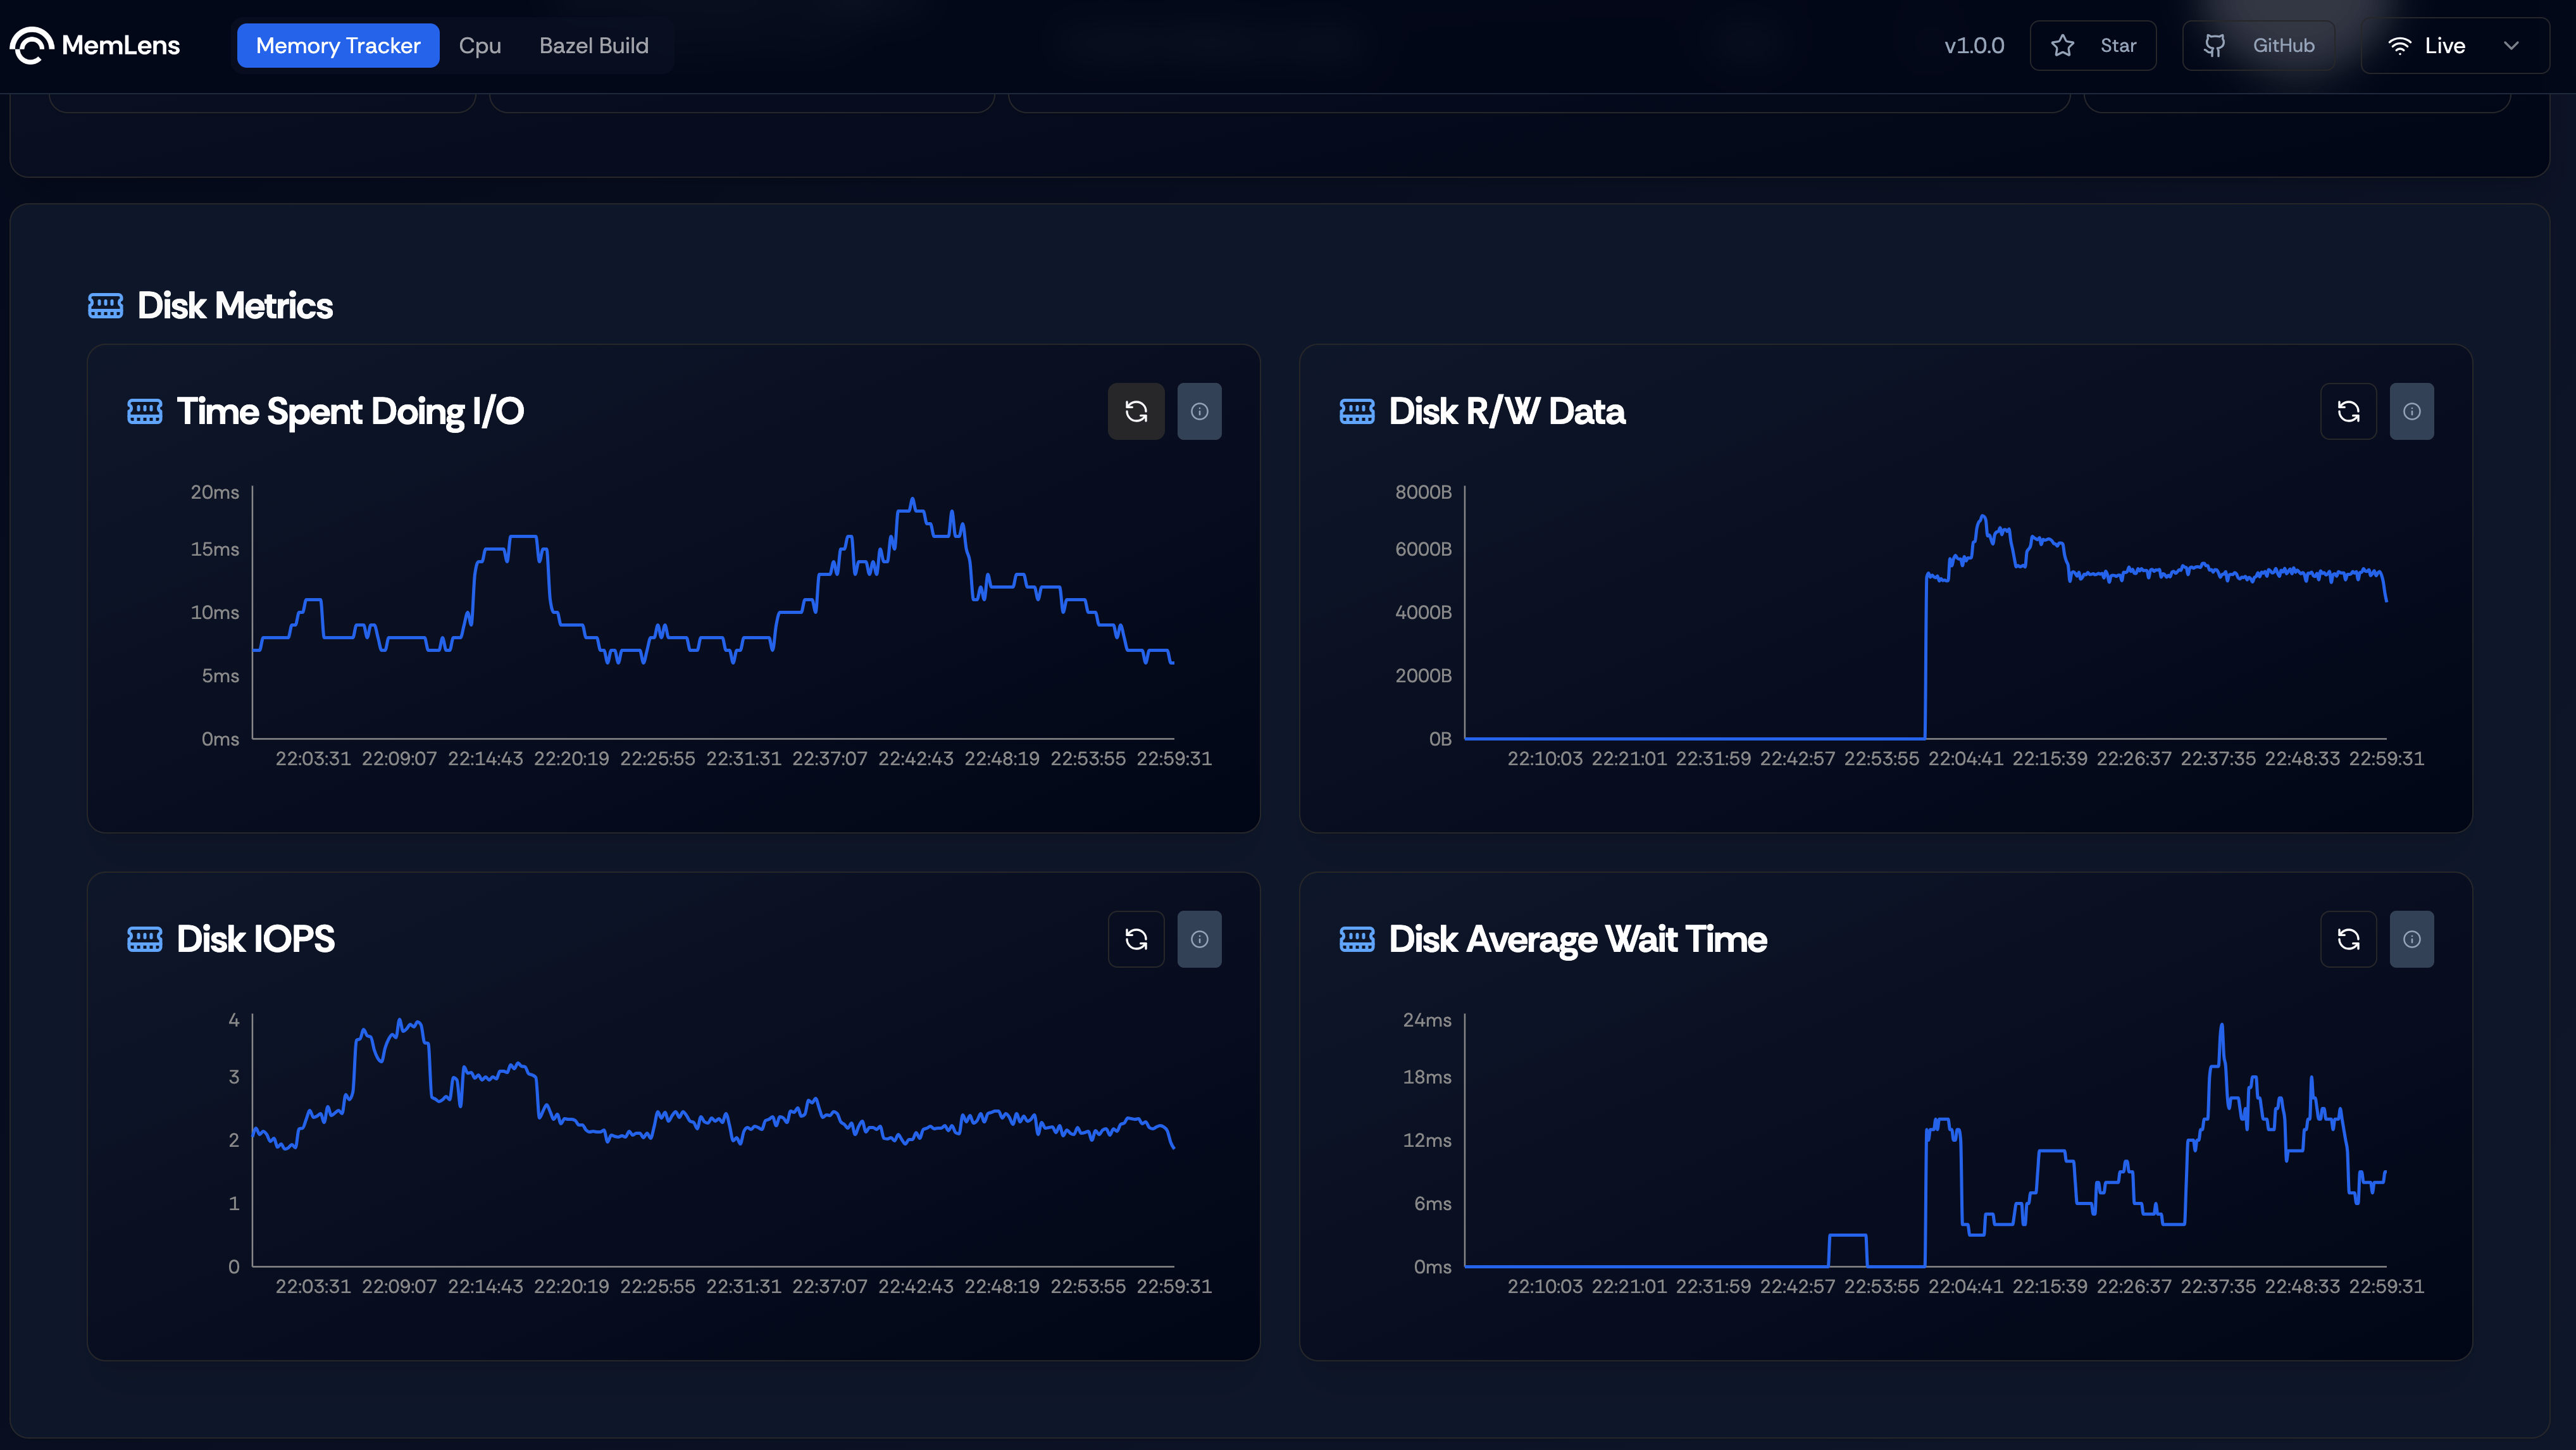
Figure 4. Dashboard showing Disk metrics.
Dashboard showing disk metrics like time spent during IO, disk read and write data, disk IOPS (Input and Output operations per second) and disk average wait time. These metrics are exposed by node_exporter and are exporter through prometheus. We run node_exporter as systemd process to ensure persistent monitoring.
Dependency Analyzer
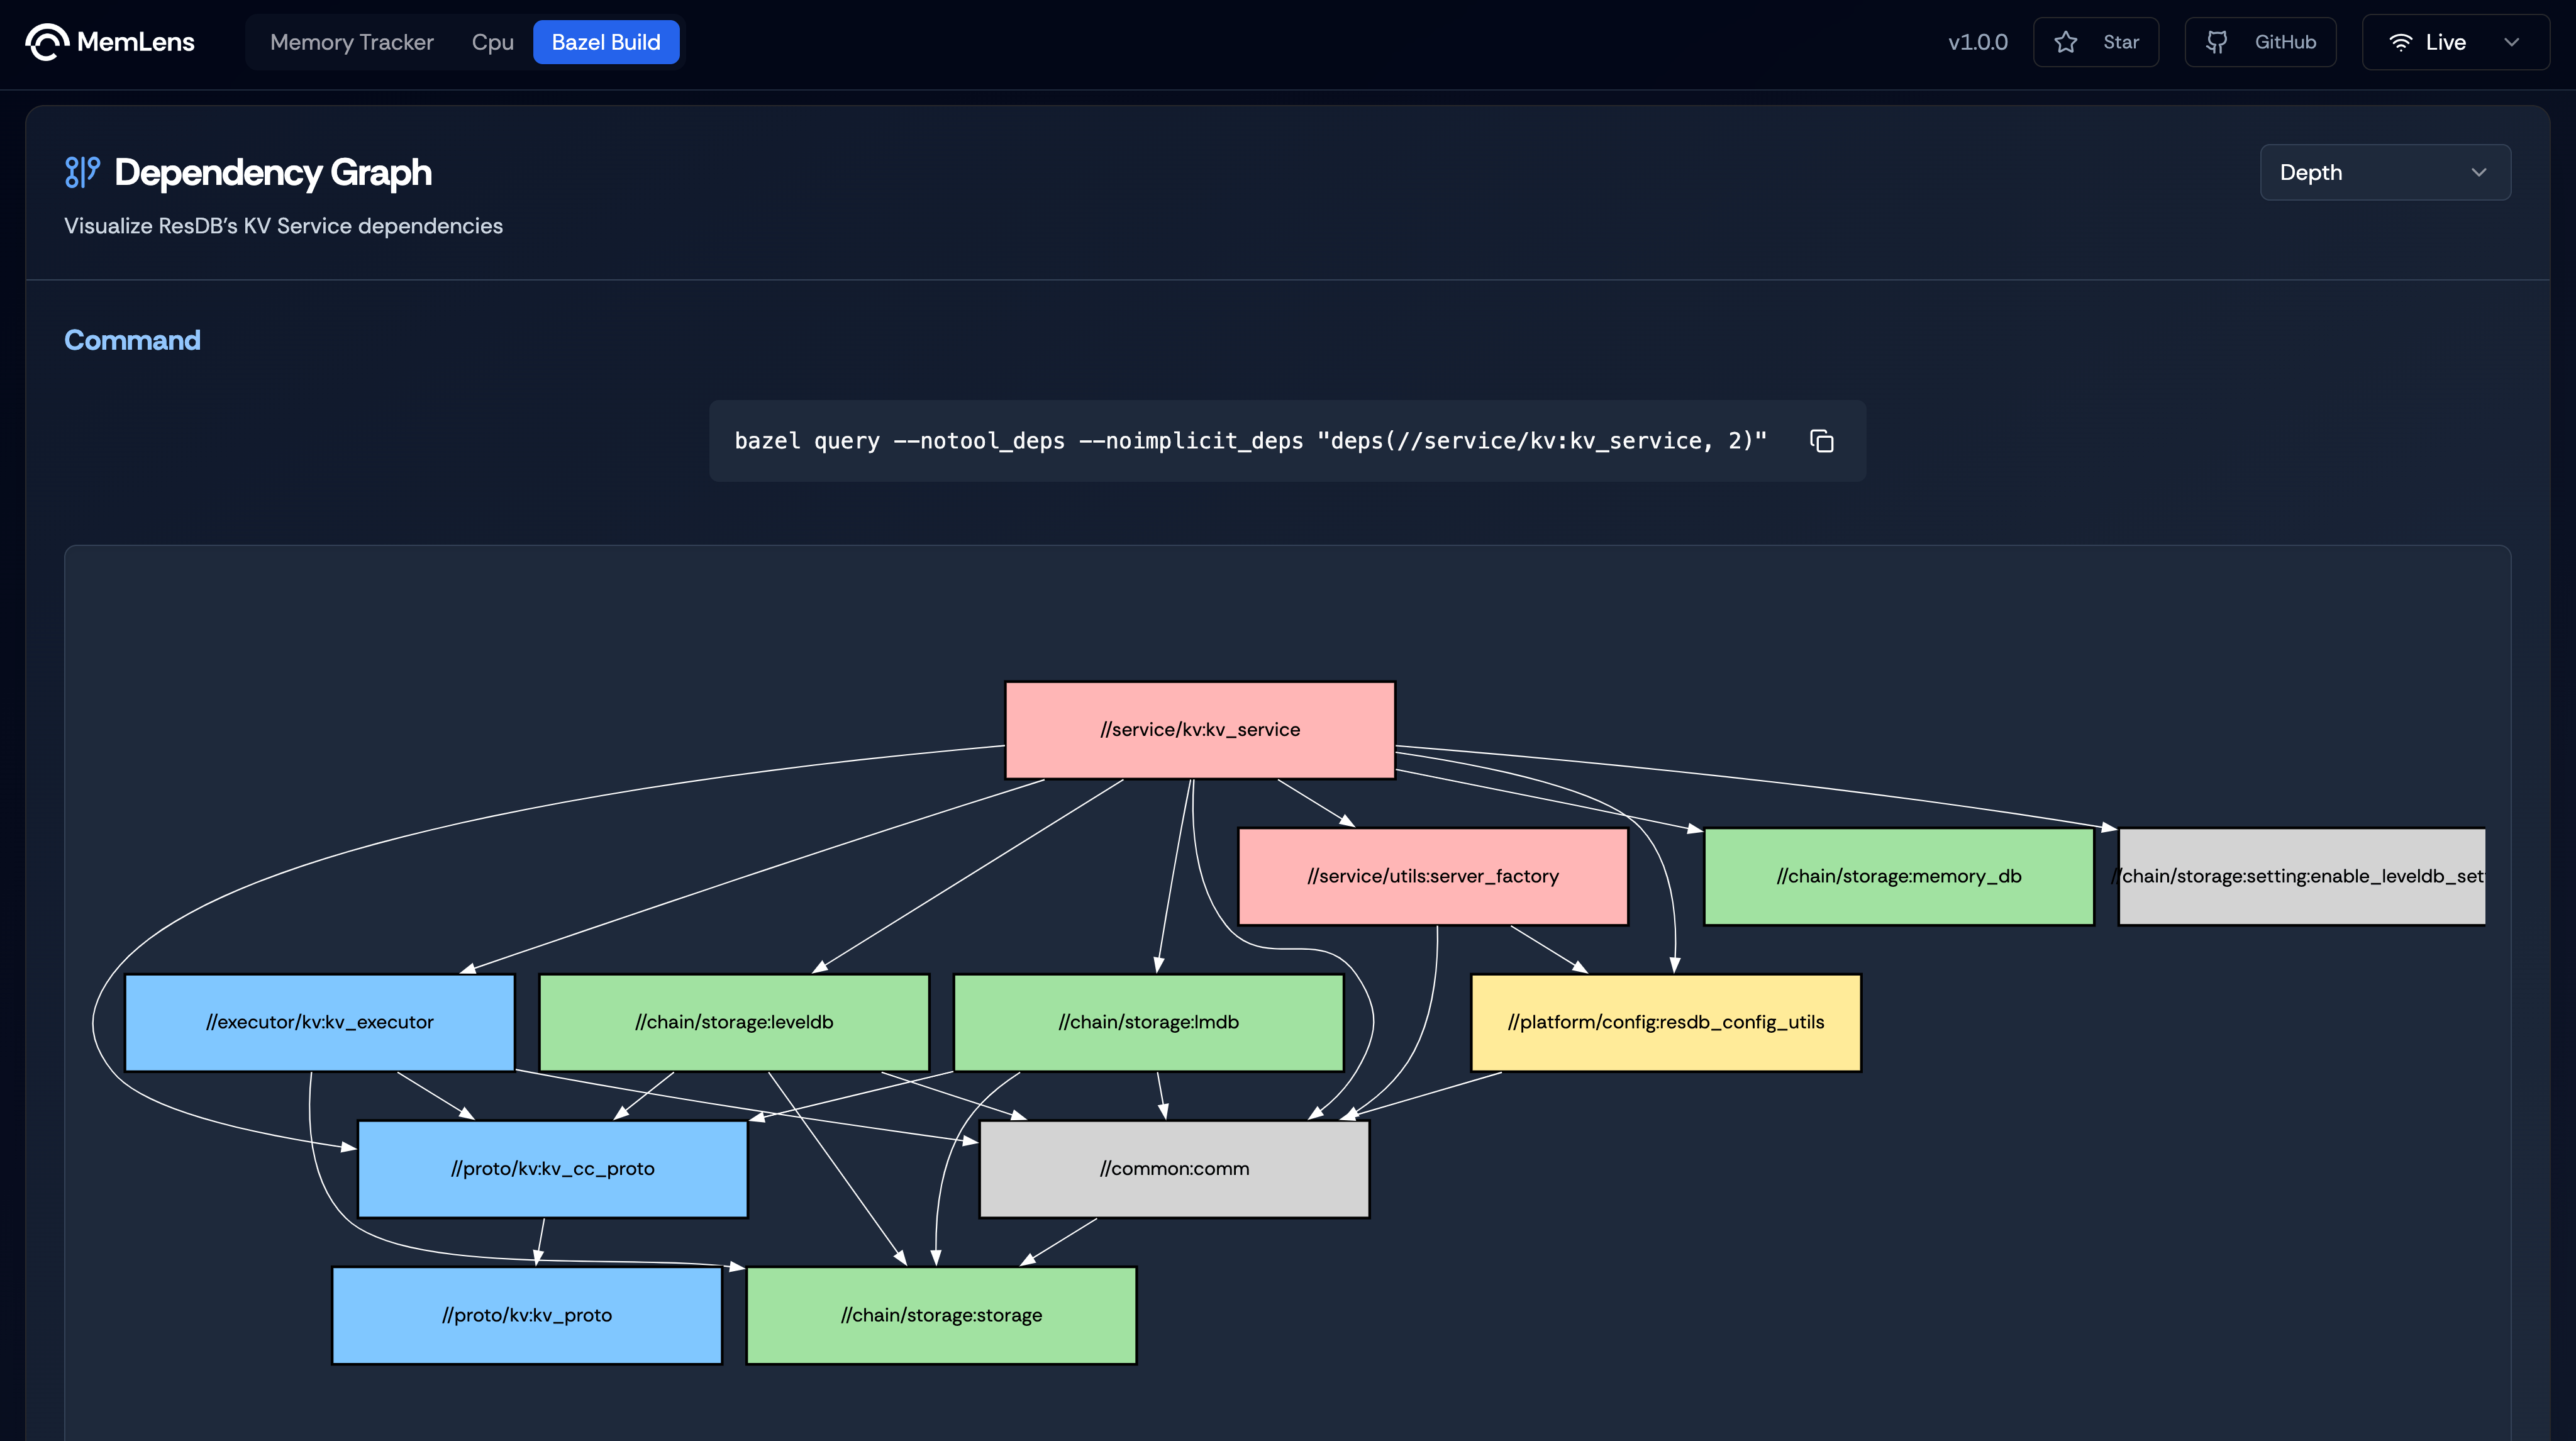
Figure 5. Dependency Graph for ResDB's KV Service.
Dependency Graph for ResDB’s KV Service obtained by running the command bazel query --notool_deps --noimplicit_deps "deps(//service/kv:kv_service, $(depth))". The value of depth can be selected among 2,3 and 4. This generated a deeper dependency graph with links to libraries and other dependent services.
Data Collection
MemLens uses a data aggregation layer, a thin HTTP service which sits between the Visualizer and the ResDB environment. As the name suggests this aggregation layer collects data from various profiling tools and exposes a single platform for the frontend to request data. We chose this architecture as it would allows us to scale this system by introducing a time series databases in the future and collect data over a period of time and analyze trends and gauge behaviour.
Data Sources
MemLens leverages a wide range of tools and integrations to provide detailed, real-time performance insights for ResilientDB. By utilizing data from various industry-standard sources, MemLens offers a holistic view of system performance. Below is an overview of the key data sources:
1. LevelDB CPP Hooks
- Purpose: Provides access to internal statistics and performance metrics of LevelDB.
- Integration: Custom hooks enable MemLens to monitor and profile critical metrics such as:
- Cache hit/miss ratios.
- Read/write latencies.
- Compaction stats and storage utilization.
- Benefits: Delivers database-specific insights that help optimize LevelDB’s storage layer performance.
2. Node Exporter
- Purpose: Collects hardware and operating system metrics.
- Integration: Node Exporter gathers low-level system data such as:
- CPU utilization and system load.
- Memory usage (heap, stack, swap).
- Disk I/O and network throughput.
- Benefits: Provides a baseline for understanding system resource utilization alongside database performance.
3. Process Exporter
- Purpose: Monitors resource usage at the process level.
- Integration: Tracks resource usage specific to ResilientDB processes, including:
- Per-process CPU and memory consumption.
- Process life cycles and thread usage.
- Benefits: Enables granular profiling of ResilientDB, isolating bottlenecks at the process level.
4. Pyroscope
- Purpose: Enables continuous profiling for CPU and memory usage.
- Integration: Captures detailed call stacks and resource usage trends over time, including:
- Hot path identification for CPU-intensive operations.
- Memory allocation and garbage collection patterns.
- Benefits: Provides a time-series view of performance, enabling developers to pinpoint and resolve inefficiencies effectively.
5. Prometheus
- Purpose: Collects and queries time-series data.
- Integration: Custom Prometheus hooks gather both standard and database-specific metrics such as:
- Query execution latencies.
- Disk write/read performance.
- Custom database events for fine-grained profiling.
- Benefits: Delivers a unified and extensible monitoring solution, enabling seamless visualization through dashboards like Grafana.
Demo Video
Usage
Prerequisites
Before running the MemLens application, you need to start kv service on the ResDB backend and the sdk.
ResilientDB
Git clone the MemLens backend repository, a fork of ResilientDB and follow the instructions to set it up:
git clone https://github.com/harish876/incubator-resilientdb
Setup KV Service:
./service/tools/kv/server_tools/start_kv_service_monitoring.sh
SDK
Git clone the GraphQL Repository and follow the instructions on the README to set it up:
Install GraphQL:
git clone https://github.com/ResilientApp/ResilientDB-GraphQL
Setup SDK:
bazel build service/http_server:crow_service_main

bazel-bin/service/http_server/crow_service_main service/tools/config/interface/client.config service/http_server/server_config.config
Middleware
Git clone the MemLens Middleware Repository:
Install MemLens Middleware:
git clone https://github.com/harish876/MemLens-middleware
Setup MemLens Middleware:
npm install
npm run start
Monitoring tools
Follow this link to setup prometheus, grafana and a few other monitoring tools used in this application.
With these 3 services running, the MemLens front end can now send aggregate metrics from the middleware.
Running the MemLens Application
Clone the repo and open in a new folder.
git clone https://github.com/Bismanpal-Singh/MemLens
npm install
Run the below code to start the app and load the script.
npm run dev
Using the MemLens Application
Once MemLens has been started, go to http://localhost:5173
You will see a landing page with a brief description of the project and on scrolling down will see a brief of the PBFT protocol, and a explorer card to access the dashboard.
Once the dashboard page has loaded, it will make an API call to the middleware running on http://localhost:3002 to check if the middleware is active and running. If the middleware is running and all profiling tools are installed then , the dashboard switches to a Live mode which fetches live data from the middleare. If no accompanying backend services are running, then the app switches to a Offline mode which loads snapshots of data collected by the team. This mode could be used for exploration and familiarising with the interface.
The dashboard has 3 tabs, Memory Tracker, CPU and Bazel Build. The memory tracker loads a playground which is a terminal emulator to GET and SET values into the KV store. A dashboard card dedicated to storage engine metrics and disk metrics. Each graphical card can be be refreshed which will refresh the data. The CPU tab displays a CPU Line graph which displays a graphical view of CPU usage over a period of time, and a accompanying flamegraph to display the call stack. The line graph can be highlighted into in order to magnify the CPU usage over that specific time window and the flamegraph automatically updates according to the time frame chosen. The bazel build tab displays a dependency graph showcasing the dependencies for the KV service and a select menu to dynamically change the depth of the graph output and the command run to generate the visualized build data.
Future Work
- Package, installation and setup of monitoring tools into a bash script or ansible playbook.
- Remote setup of MemLens middleware and migrating the current setup to an AWS EC2 instance or Linode.
- Set up profiling tools on a Raspberry Pi and collect metrics.
- Development of eBPF profiler from scratch and integrating it into code, instead of using a sandboxed profiling environment.
- Stabilising metric collection and develop a
remotemode to push data into InfluxDB or equivalent time series database to analyze trends.
Source Code Repositories
MemLens Frontend
MemLens Middleware
MemLens Backend / ResDB Fork
ResDB GraphQL
Slides
Link to - Presentation Slides
Contributions
- Designed the project architecture and proposed innovative feature ideas.
- Integrated profiling tools and developed C++ hooks to export LevelDB statistics, memory metrics, and explored alternatives like integrating an LMDB storage layer.
- Developed a middleware layer to ensure seamless end-to-end connectivity between the monitoring environment and the frontend.
- Implemented frontend features including Flamegraph visualization, the ability to toggle between
LiveandOfflinemodes, and a terminal emulator. - Created scripts to bootstrap monitoring tools and set up the profiling environment efficiently.
- Authored comprehensive project documentation, estimated timelines, conducted research on existing tools, tested feasibility, and explored ideas that were ultimately not included in the final implementation.
- Collaborated on designing and conceptualizing the frontend’s look and feel, exploring component libraries and frameworks, and testing feature feasibility.
- Designed the UI/UX architecture, including the skeleton, contexts, and pages. Developed the primary PBFT diagram, set up graph component skeletons, and styled the application for cohesive functionality and aesthetics.
- Created and integrated key frontend components such as the Navbar, links,
INFOtags on graphs, and refresh button functionality. IncorporatedLiveandOfflinemodes seamlessly into the frontend. - Led the full-stack integration of
Disk Metriccards, including middleware API development and frontend implementation. Developed reusable components for graph display and utilities for efficient data fetching. - Architected and managed frontend features, ensuring project milestones were met consistently while maintaining high standards of quality and usability.
- Contributed to project ideation, exploring profiling tools and assessing the feasibility of various features.
- Led efforts to expand the project scope, introducing support for additional facets such as running
ResilientDBon Raspberry Pi. - Addressed and resolved challenges in setting up
ResilientDBon Raspberry Pi, including testing multiple Pi versions and stabilizing overheating issues. - Maintained a project tracker to monitor progress, manage tasks, and ensure timely delivery of milestones.
- Set up comprehensive documentation for GitHub repositories, enabling clear guidance for contributors and maintaining project standards.
- Polished the visual design and functionality of the application, including creating a sliding button link for a smoother user experience. Assisted team during the presentation by ensuring the frontend was presentation-ready.
- Supported the development of frontend components, enhancing usability and visual appeal while ensuring seamless integration with the backend.
- Played a key role in developing features like Bazel build visualization to enhance project debugging and performance monitoring capabilities.
Notable Contributions
Shreya - For designing the MemLens logo, bringing creativity and a design to the project.