Distributed databases and blockchain systems depend on consensus protocols to maintain consistency, yet few tools exist for observing protocol behavior in live deployments. Existing approaches typically rely on static simulation, offline trace replay, or intrusive instrumentation—each of which is costly and falls short of capturing runtime execution.
DeepObserve addresses this gap as an observability framework for Apache ResilientDB. As part of the DeepObserve project, we present two eBPF-based applications—ResView and ResLens—that instrument running systems with minimal code changes. Each runs as a sidecar, decoupling telemetry from the database execution path and providing low-code, language-agnostic instrumentation. DeepObserve also exposes these tools through MCP servers, enabling AI agents to connect, query runtime behavior, visualize subprotocol execution, and inspect call-stack flamegraphs.
Motivation
Observability is defined as the degree to which the internal state of a system can be inferred from its external outputs. These outputs—logs, metrics, and traces—enable operators to gauge system health, measure performance, and evaluate compliance with service-level objectives (SLOs).
Despite its importance, achieving effective observability in production distributed systems remains challenging. Conventional instrumentation relies on language-specific SDKs that embed telemetry logic directly alongside application logic. Each observability goal typically requires a dedicated toolchain: consensus visualization may depend on high-volume log ingestion through systems such as Loki or Elasticsearch, while continuous profiling requires Grafana Pyroscope or language-specific profilers. This fragmentation increases operational complexity and often forces trade-offs between visibility and performance.
Approach
DeepObserve is built on two core design decisions: running observability as a sidecar, and using eBPF for instrumentation. Together, they keep telemetry out of the database hot path while still providing protocol-aware visibility at runtime.
Why a Sidecar Pattern
In conventional observability setups, telemetry logic lives inside the application—timestamps are recorded in consensus handlers, statistics are serialized and pushed over websockets, and profiling hooks are woven through storage and execution code. This co-location creates several problems. Instrumentation competes with consensus logic for CPU and memory on the critical path, changes to observability require modifying and redeploying the database itself, and enabling or disabling telemetry often means recompilation or runtime configuration deep inside the system.
DeepObserve moves all of this into a sidecar process that runs alongside ResilientDB without sharing its execution context. The database exposes lightweight trace dispatch points; the sidecar attaches externally, collects events, and serves them to visualization frontends and MCP servers. When observability is not needed, the sidecar can be stopped entirely—the database continues running unaffected. This separation also means each observability concern (consensus tracing, continuous profiling) can evolve independently, as its own deployable unit, without destabilizing the core system.
How eBPF Enables Low-Code Instrumentation
eBPF (extended Berkeley Packet Filter) is a Linux kernel technology that allows sandboxed programs to attach dynamically to kernel and user-space execution points. For DeepObserve, the key capability is uprobes—probes that fire when specific user-space functions are invoked. We define minimal trace dispatch functions at consensus and storage boundaries in ResilientDB. When a probe is attached, eBPF captures function arguments, timestamps, and thread metadata at the point of execution. When no probe is attached, these dispatch points compile down to near-zero overhead.
This model replaces large amounts of hand-written instrumentation. The original ResView data collection path required over 600 lines of in-process telemetry code embedded across the consensus layer. The eBPF-based approach reduces this to lightweight hooks under 250 lines, with the sidecar handling collection, aggregation, and export. Because probes attach at the binary level rather than through language-specific SDKs, the same pattern extends to other subsystems and, in principle, to other consensus implementations—without rewriting application logic for each observability goal.
Applications
As part of the DeepObserve project, we present two applications:
- ResView — traces and visualizes client requests through consensus protocol stages in real time.
- ResLens — provides continuous CPU and memory profiling with call-stack flamegraphs for ResilientDB runtime analysis.
Both run as eBPF sidecars and are accessible to AI agents through MCP servers.
Architecture
The diagram below shows the general DeepObserve architecture: trace dispatch hooks in ResilientDB, eBPF probe attachment in the sidecar, and export to visualization frontends and MCP servers.
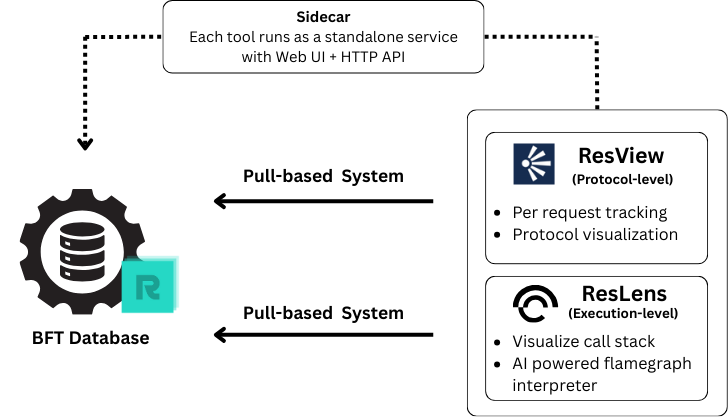
Figure 1. DeepObserve pipeline—ResilientDB trace hooks feed eBPF sidecars, which export telemetry to visualization frontends and MCP-connected agents.
At a high level, a client request enters ResilientDB and flows through the consensus layer. At each instrumented stage, a trace dispatch function emits metadata (sequence number, message type, sender, timestamp). The eBPF sidecar captures these events via uprobes, correlates them by request, and forwards structured traces to the ResView frontend. ResLens follows the same sidecar model but attaches profiling probes to capture CPU and call-stack samples, which are aggregated into flamegraphs. Both applications are exposed to AI agents through the DeepObserve MCP server, described below.
ResView
ResView is DeepObserve’s consensus visualization application. It traces individual client requests through the full lifecycle of a consensus protocol and renders protocol-aware diagrams from live execution data.
Features
- Traces and visualizes requests through any consensus algorithm; our primary focus is PBFT (Practical Byzantine Fault Tolerance).
- Visualizes each protocol stage—PRE-PREPARE, PREPARE, COMMIT, and others.
- Visualizes PBFT sub-protocols such as commitment and view change.
- Displays real-time message flow and timing information between replicas and clients.
- Measures latency across consensus stages and quorum formation.
- Helps observe leader changes and faulty replica behavior.
- MCP-enabled interface allows AI agents to autonomously trigger workloads and visualize PBFT execution flows.
- Migrates a manually instrumented visualization module (600+ LOC) to extensible eBPF hooks (<250 LOC).
Design
ResView’s instrumentation pipeline has three layers: lightweight hooks in the consensus code, modular eBPF probe programs in the sidecar, and consumers that render or query the parsed output.
Why hooks are needed. ResilientDB’s consensus layer is written in C++, where function names are mangled at compile time. eBPF uprobes cannot reliably attach to mangled symbols in a portable way, so we add a thin layer of trace dispatch hooks—just a few lines of formatting code per consensus stage. These hooks are called directly from the consensus logic (e.g., pre-prepare, prepare, commit, view change) and expose stable, unmangled entry points for the sidecar to attach to.
A trace hook is a minimal extern "C" function marked noinline, with arguments passed through inline assembly so eBPF uprobes can read them from registers:
__attribute__((noinline)) void resdb_trace_pbft_commit_state(
    uint64_t req_ptr, uint64_t seq, uint64_t meta, uint64_t proxy_id,
    int64_t epoch_ns) {
  asm volatile("" : : "r"(req_ptr), "r"(seq), "r"(meta), "r"(proxy_id),
               "r"(epoch_ns)
               : "memory");
}
The hook is invoked from consensus logic at the point of interest. Metadata—message type, sender, and replica ID—is packed into a single 64-bit value before the call:
int Commitment::ProcessCommitMsg(std::unique_ptr<Context> context,
                                 std::unique_ptr<Request> request) {
  // ...
  uint64_t seq = request->seq();
  uint64_t req_ptr = reinterpret_cast<uint64_t>(request.get());
  uint64_t meta_commit_recv = ResdbTracePackMeta(
      static_cast<uint32_t>(request->type()),
      static_cast<uint32_t>(request->sender_id()),
      static_cast<uint32_t>(config_.GetSelfInfo().id()));

  resdb_trace_pbft_commit_recv(
      req_ptr, seq, meta_commit_recv, proxy_id, ResdbTraceEpochNs());

  CollectorResultCode ret =
      message_manager_->AddConsensusMsg(context->signature, std::move(request));
  if (ret == CollectorResultCode::STATE_CHANGED) {
    uint64_t meta_commit_state = ResdbTracePackMeta(
        static_cast<uint32_t>(Request::TYPE_COMMIT), /*sender_id=*/0,
        static_cast<uint32_t>(config_.GetSelfInfo().id()));
    resdb_trace_pbft_commit_state(req_ptr, seq, meta_commit_state, proxy_id,
                                  ResdbTraceEpochNs());
  }
  return ret == CollectorResultCode::INVALID ? -2 : 0;
}
Sidecar and bpftrace modules. When ResView starts, the sidecar spawns a bpftrace listener for the running ResilientDB process. We define separate bpf programs for each module, each targeting a specific sub-protocol or consensus stage—commitment, view change, request intake, and others. Each module registers an uprobe on the corresponding trace dispatch hook. For example, the commitment module attaches to resdb_trace_pbft_commit_state and unpacks the packed metadata at probe time:
uprobe:/home/ubuntu/production/incubator-resilientdb/bazel-bin/service/kv/kv_service:resdb_trace_pbft_commit_state
{
  $meta = arg2;
  $type = $meta & 0xffffffff;
  $sender = ($meta >> 32) & 0xffff;
  $self = ($meta >> 48) & 0xffff;
  printf("%llu %lld %d %d commit_state %lu sender=%u self=%u proxy=%lu req=0x%lx type=%u\n",
         nsecs, arg4, pid, tid, arg1, $sender, $self, arg3, arg0, $type);
}
From probe to consumer. When a hook is invoked, the attached uprobe captures the event metadata (sequence number, message type, sender and replica IDs, timestamp) and emits it as structured log output. The sidecar parses these events, correlates them by request and replica, and reconstructs the per-request consensus timeline. The parsed traces are then exposed to downstream consumers—the ResView UI, MCP servers, and AI agents—without the database process handling any of the collection or serialization logic.
The previous ResView implementation collected statistics in-process: a data structure inside the consensus layer recorded stage timestamps and message arrivals, then pushed JSON over a websocket to the frontend. This required over 600 lines of telemetry code embedded across the consensus hot path. The eBPF redesign reduces the in-process footprint to under 250 lines of lightweight hooks—the database only declares where to trace; the sidecar and bpftrace modules decide what to capture and how to present it.
Screenshots
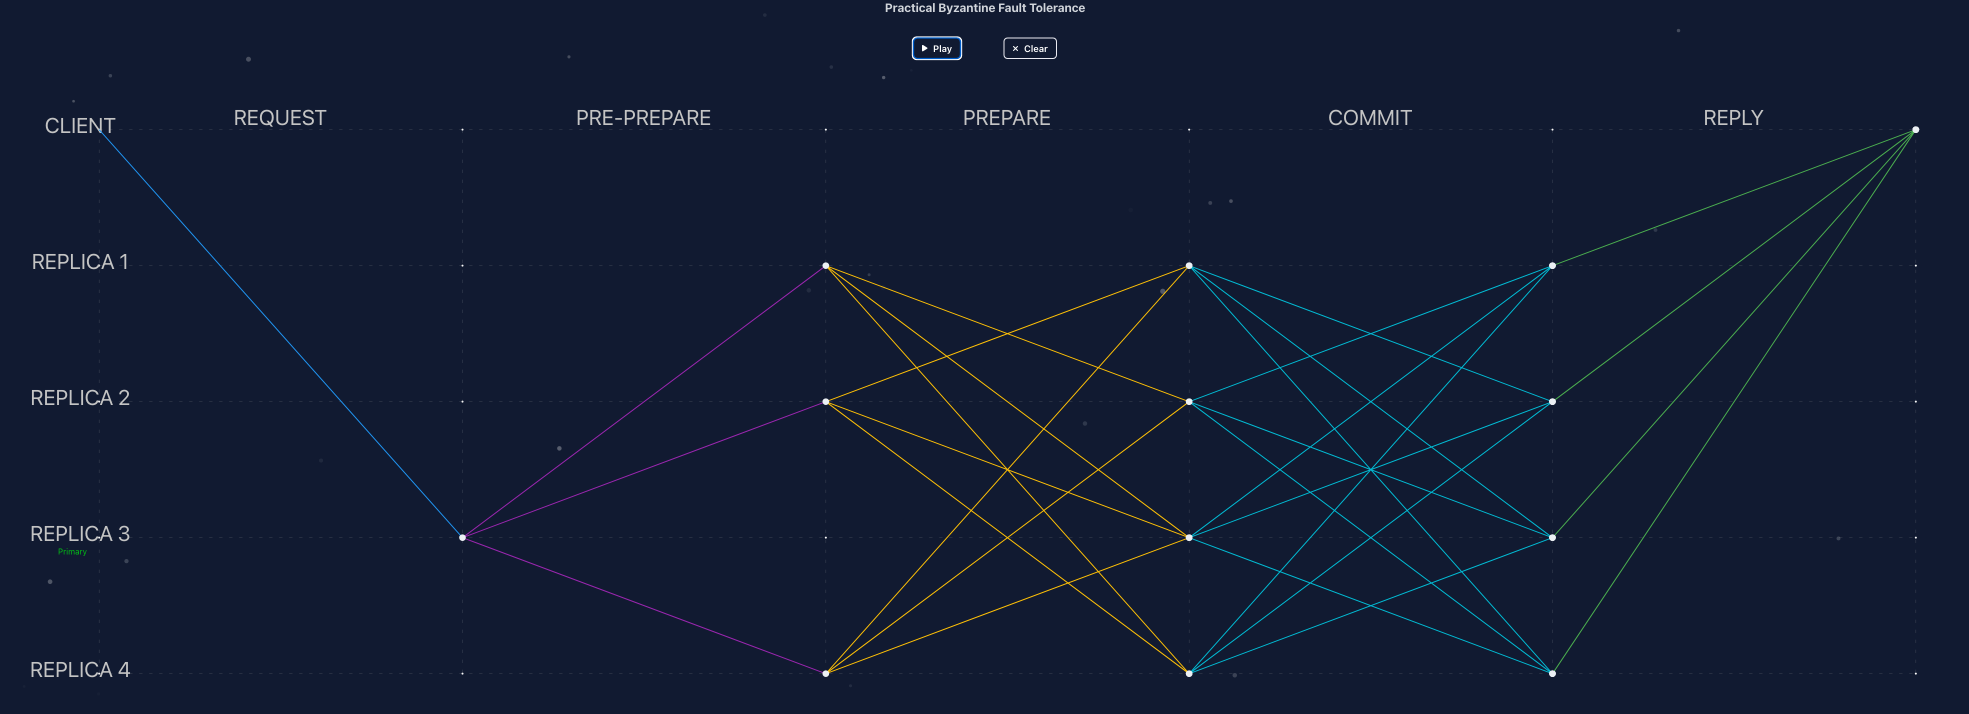
Figure 2. Normal-case PBFT message flow with Replica 3 as primary. All four replicas are healthy and participate across every protocol phase.
View in ResView
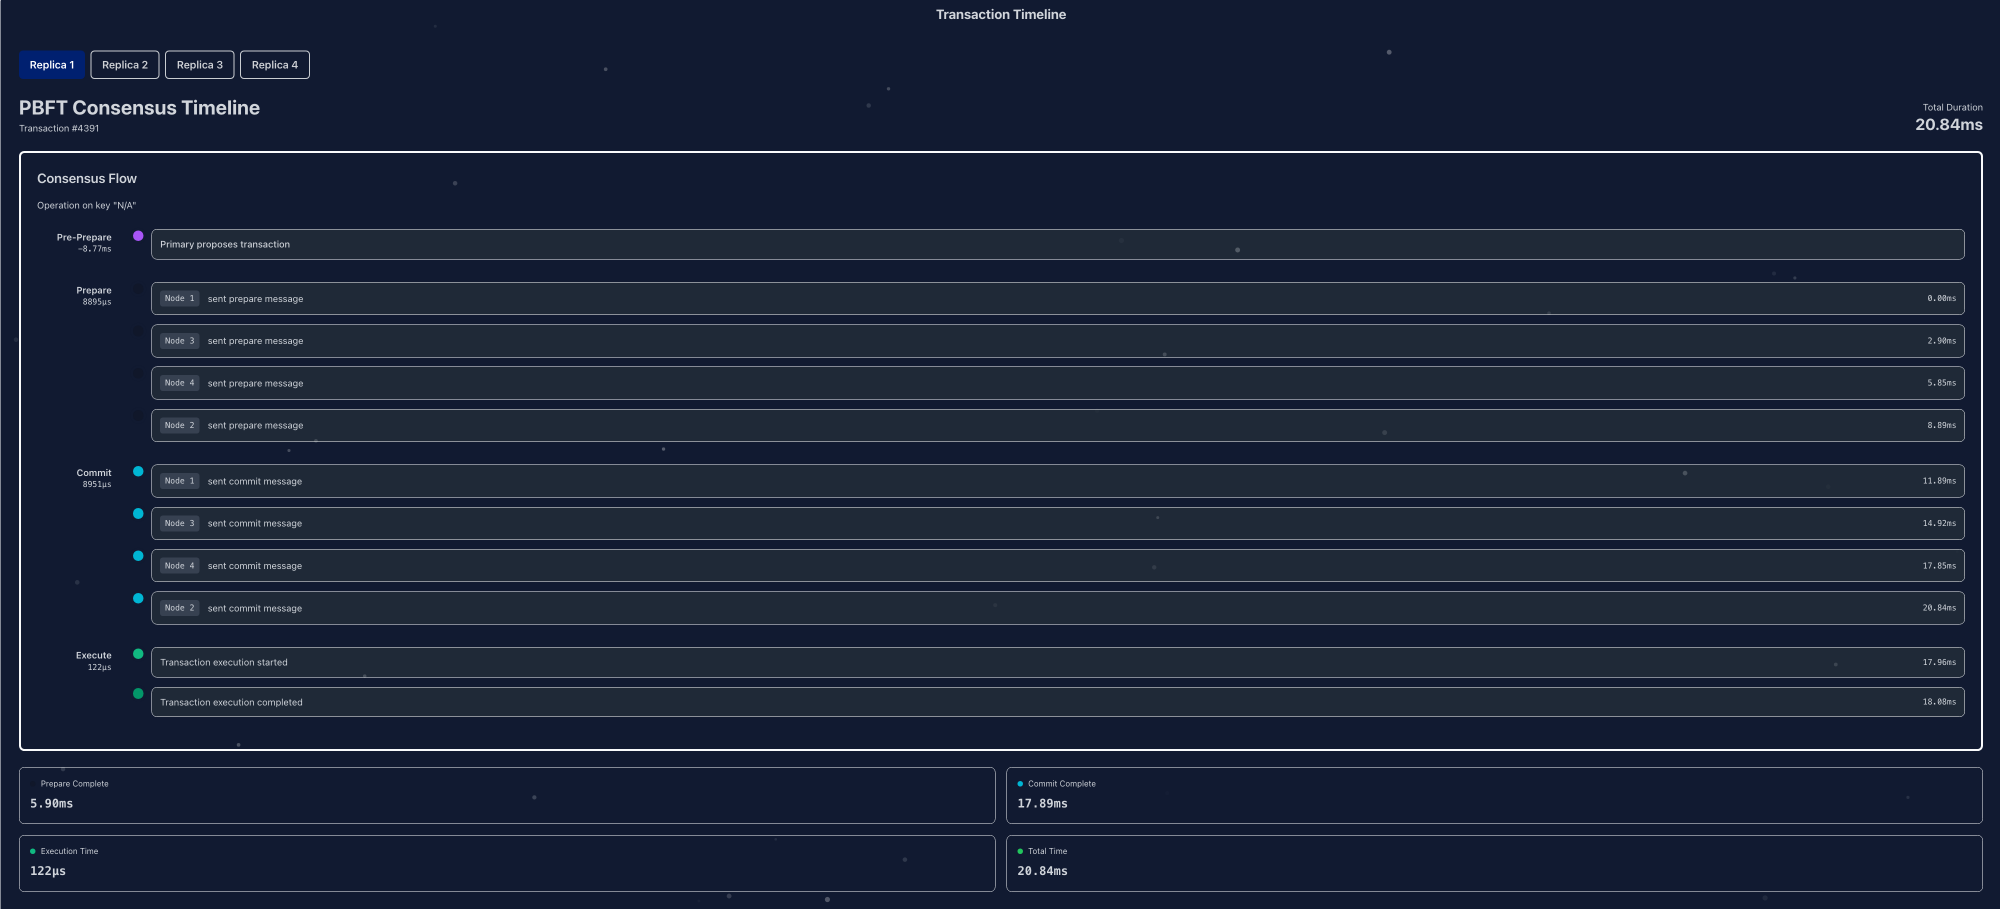
Figure 3. Consensus timeline for Transaction #4391 as observed by Replica 1, with per-stage latencies across pre-prepare, prepare, commit, and execution.
View in ResView
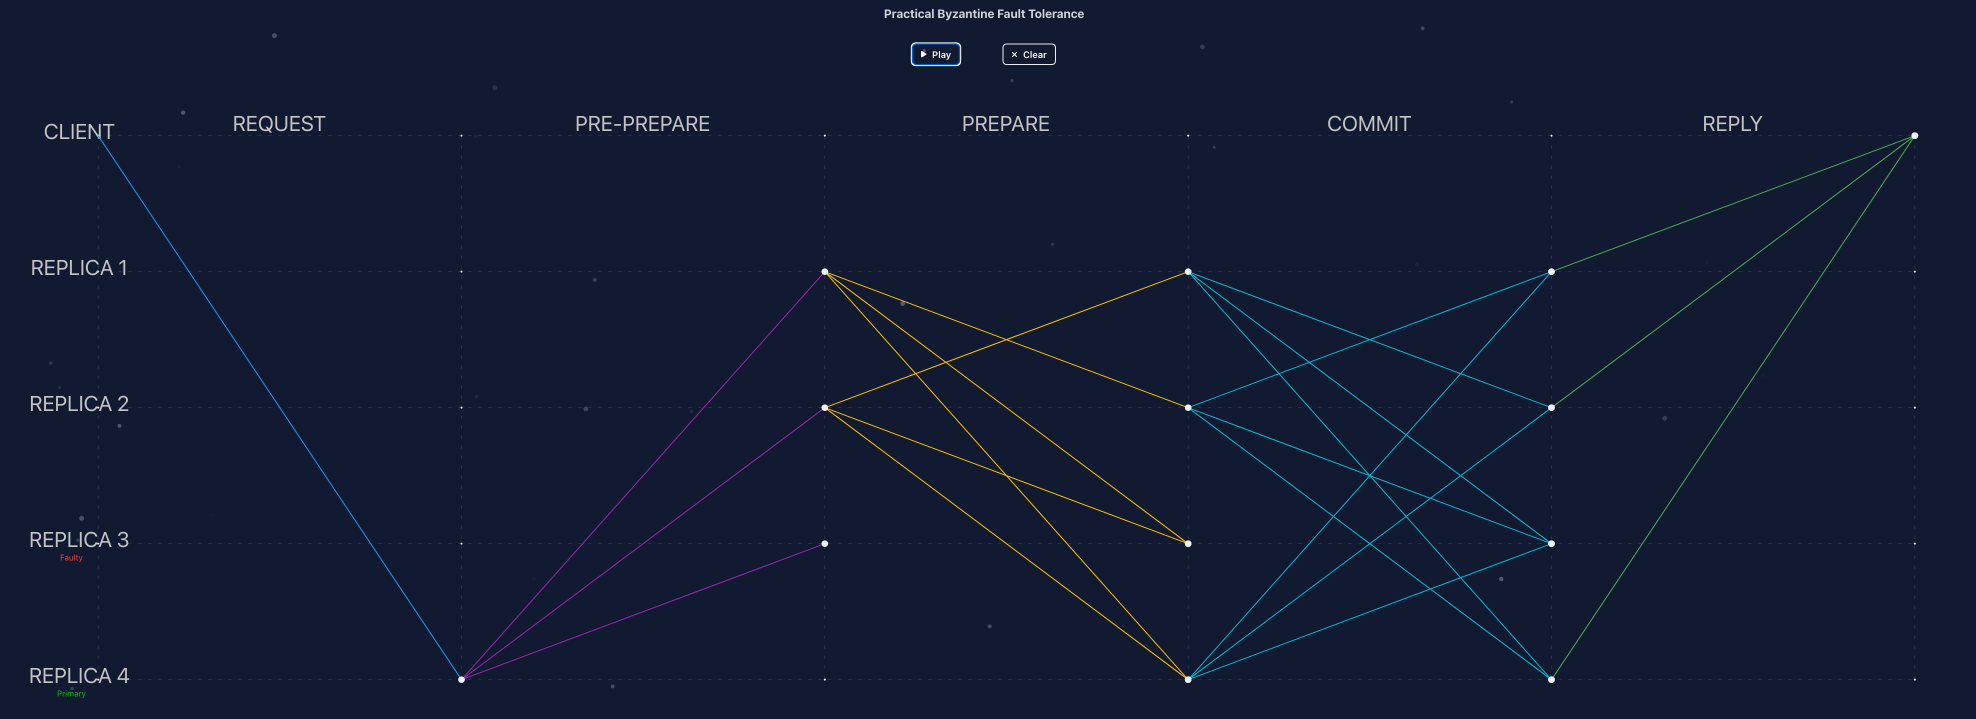
Figure 4. PBFT execution under replica failure—Replica 3 is faulty while Replica 4 serves as primary and the remaining replicas continue toward quorum.
View in ResView
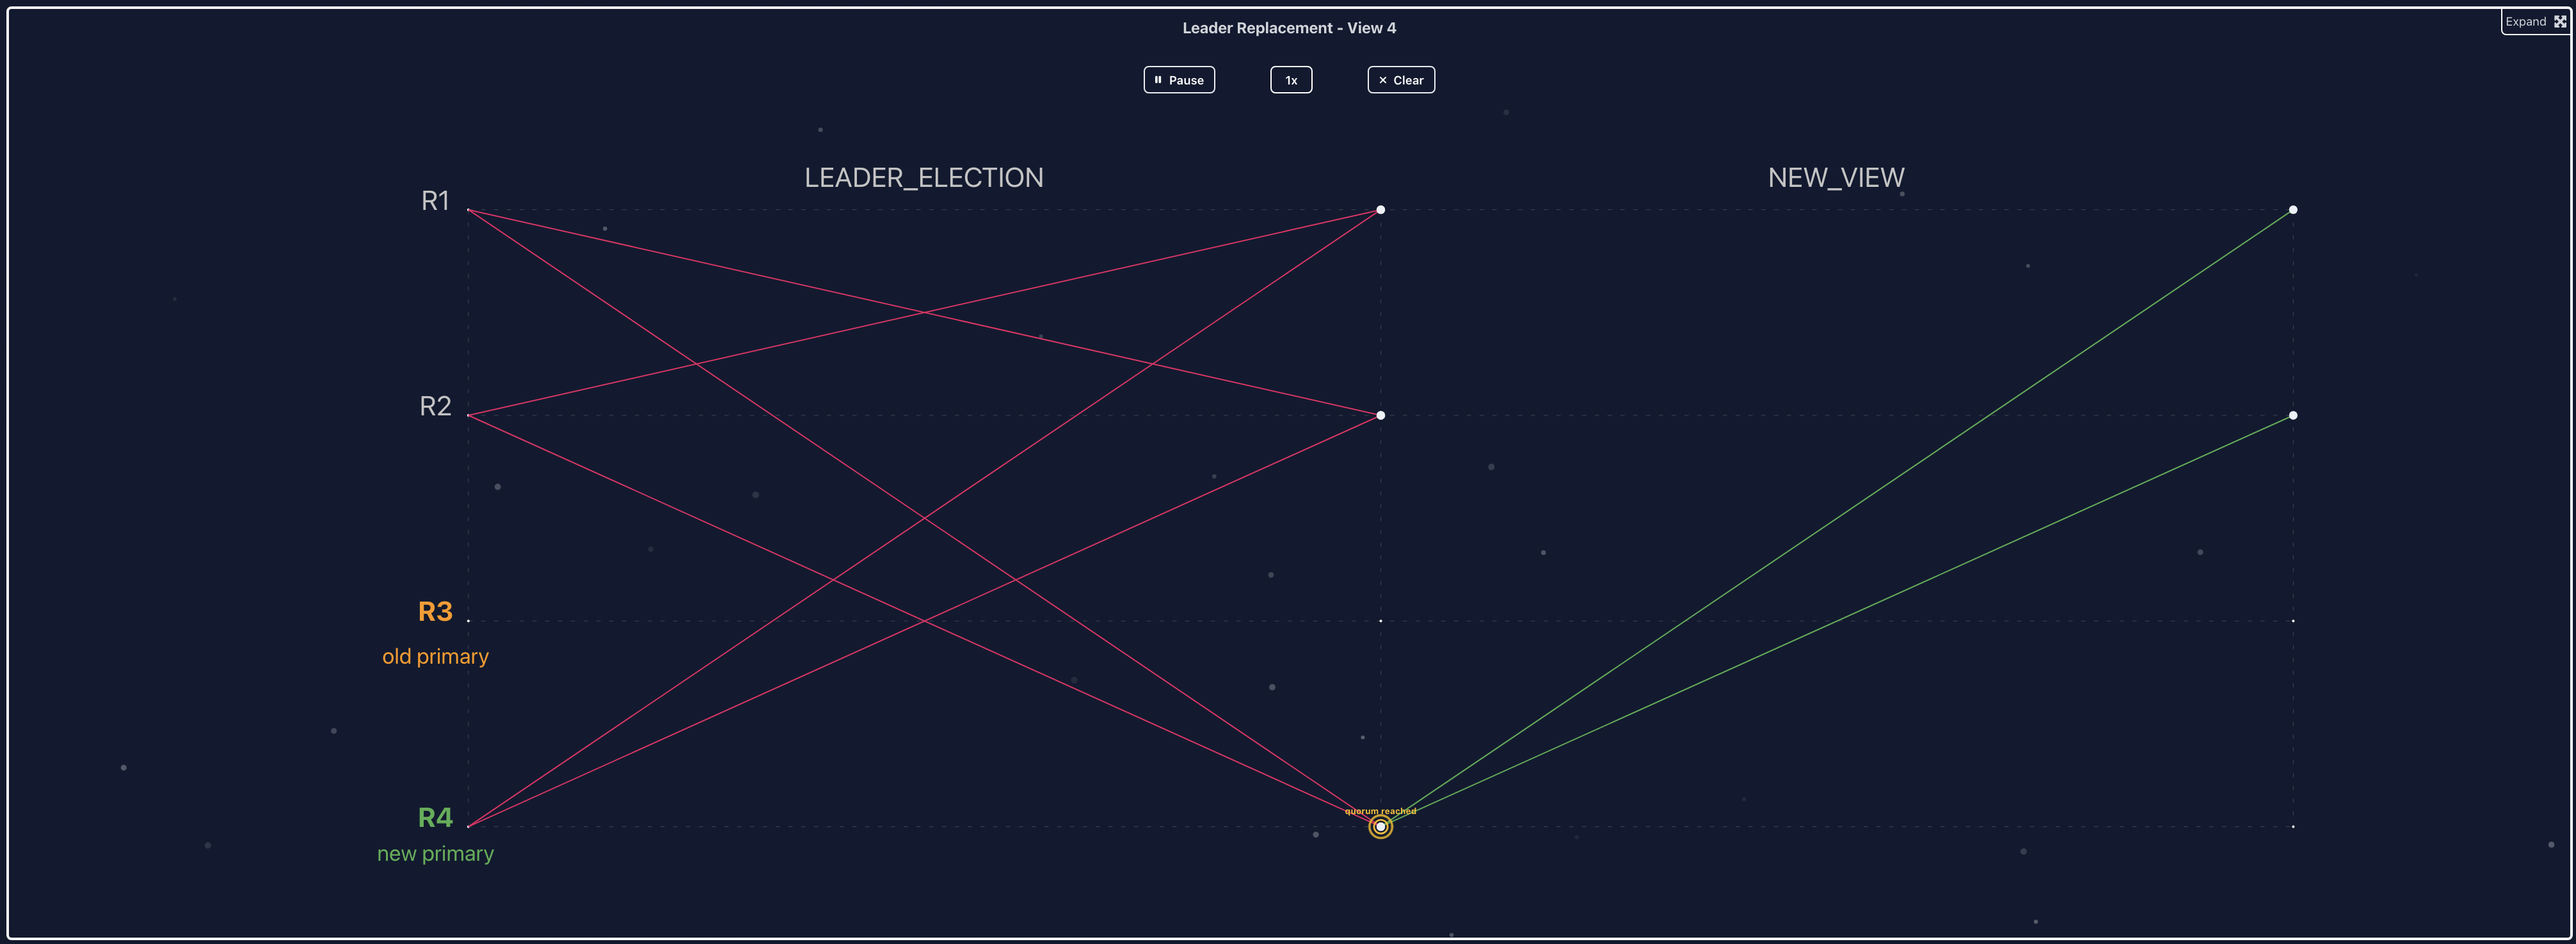
Figure 5. View change triggered by Replica 3's failure. Replicas run leader election and elect Replica 4 as the new primary before broadcasting a new view.
View in ResView
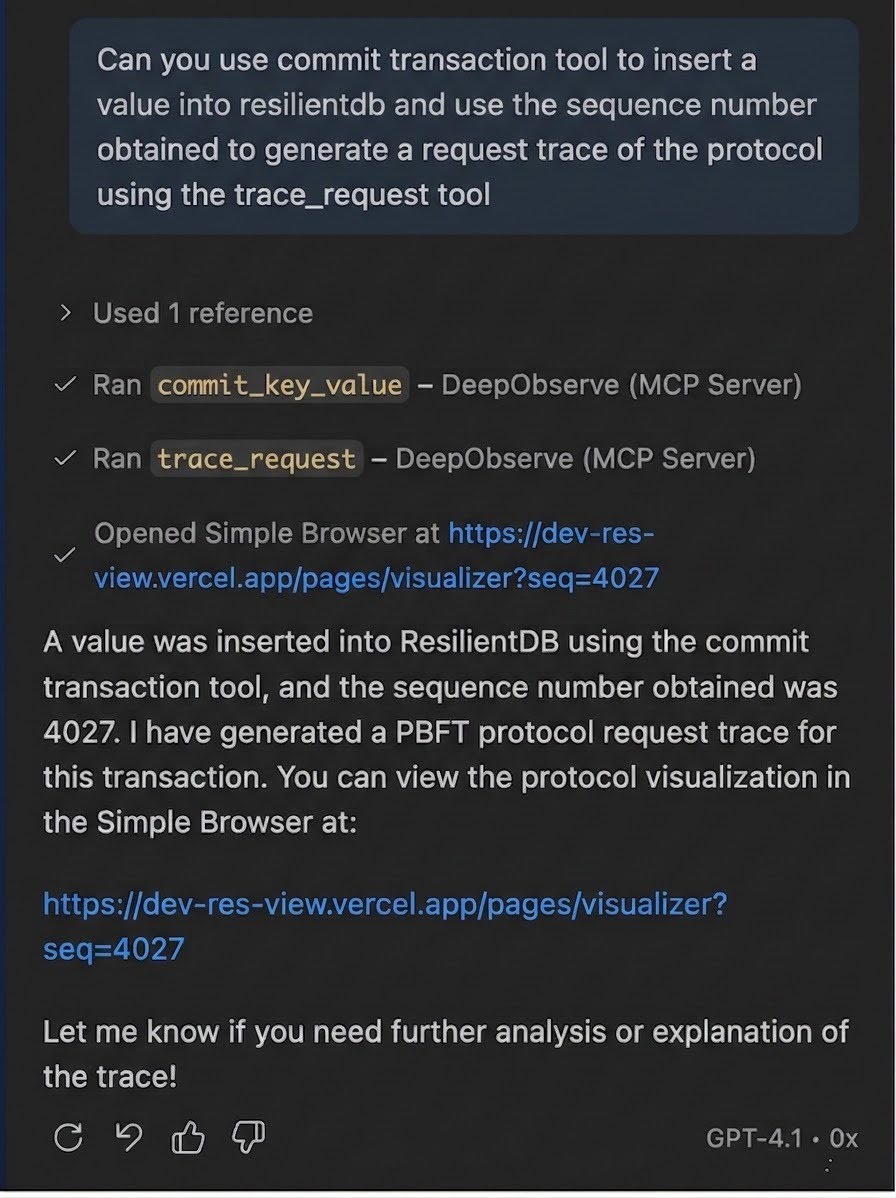
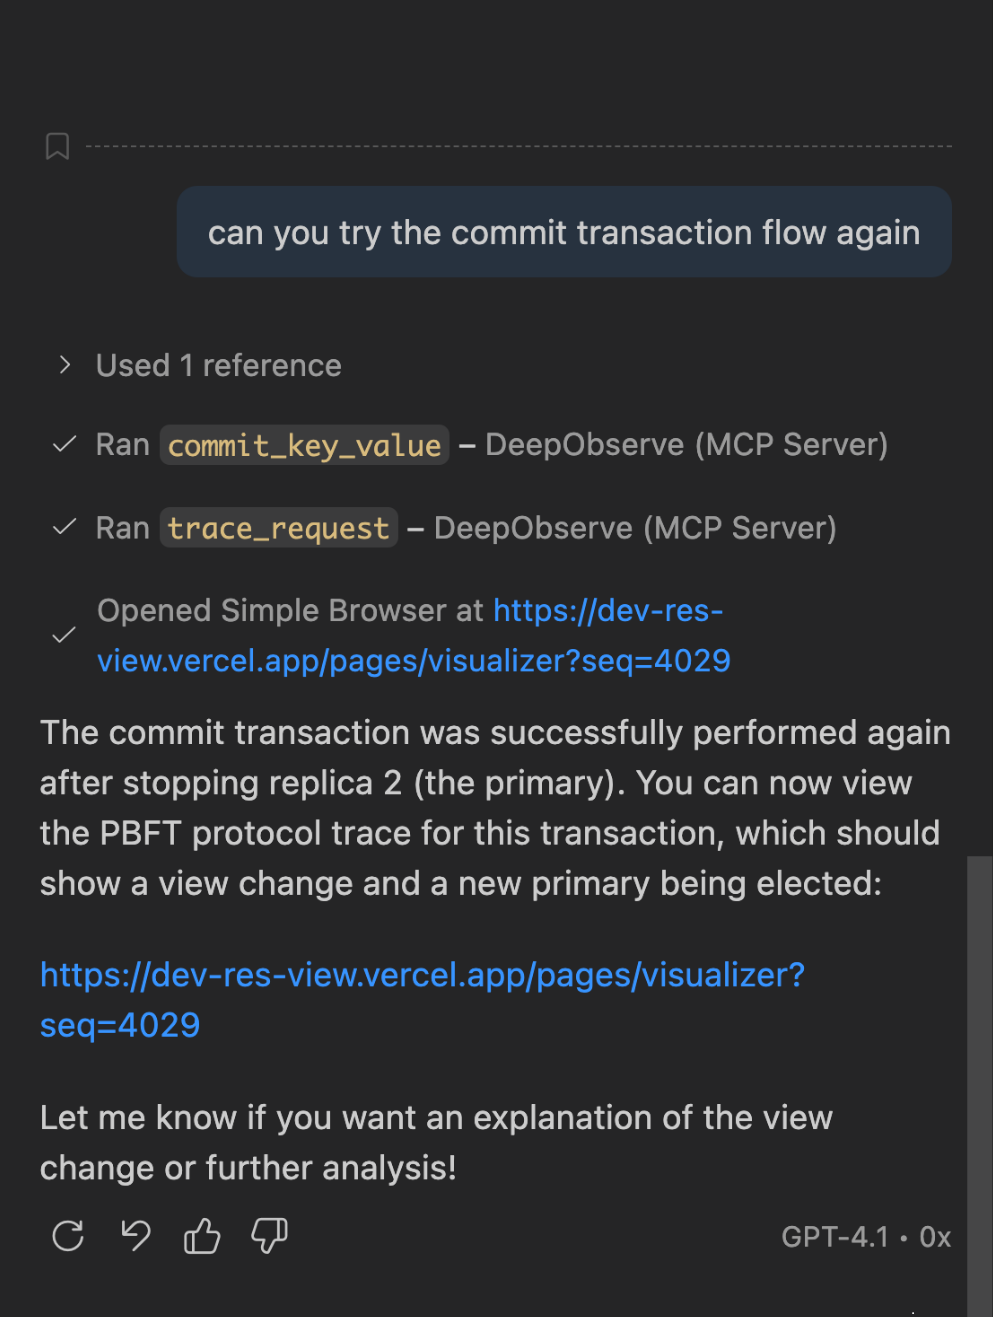
Figure 6. The MCP trace_request tool runs after commit_key_value and opens the ResView UI for user visualization.
ResLens
ResLens is DeepObserve’s continuous profiling application. It captures CPU and memory behavior of a running ResilientDB deployment and presents call-stack flamegraphs and performance metrics through a web-based dashboard.
Features
- Continuous CPU and memory profiling of ResilientDB processes with minimal overhead.
- Real-time flamegraph generation for identifying hot paths in consensus and storage code.
- Call-stack–level visibility into execution, correlated with request activity.
- eBPF-based sampling that avoids intrusive in-process profilers.
- Sidecar deployment—profiling can be enabled or disabled without restarting the database.
- MCP-enabled interface allows AI agents to fetch flamegraphs and query performance data at runtime.
Design
ResLens follows the same sidecar architecture as ResView, but targets continuous profiling rather than consensus tracing. Profiling runs externally from the ResilientDB process—the database does not need to embed profilers or expose custom hooks beyond being a target process for the sidecar to attach to.
Pyroscope and eBPF profiling. ResLens builds on Pyroscope, an open-source continuous profiling platform. We use an older version of Pyroscope specifically for its ad-hoc eBPF profiler, which supports attaching to a process that is already running without restart or recompilation. The sidecar configures Pyroscope’s eBPF spy tool to attach to the live ResilientDB process and sample CPU call stacks at runtime.
Server and client. Pyroscope provides two components that ResLens orchestrates as part of the sidecar. The server runs locally and exposes interactive flamegraphs on port 4040. The client is configured to target the ResilientDB process—when attached, it continuously collects stack samples and forwards them to the server for aggregation and visualization. The ResLens frontend reads from this Pyroscope server to render flamegraphs and profiling metrics in the dashboard.
AI-accessible flamegraph analysis. To enable AI agents to reason over profiling data, ResLens converts flamegraphs into a structured text representation using pprof. The exported markdown captures the call-stack hierarchy and sample counts in a format that MCP-connected agents can parse and query—allowing natural-language questions such as which functions dominate CPU time during consensus execution, without requiring the agent to interpret raw binary profile data or interact with the Pyroscope UI directly.
Screenshots
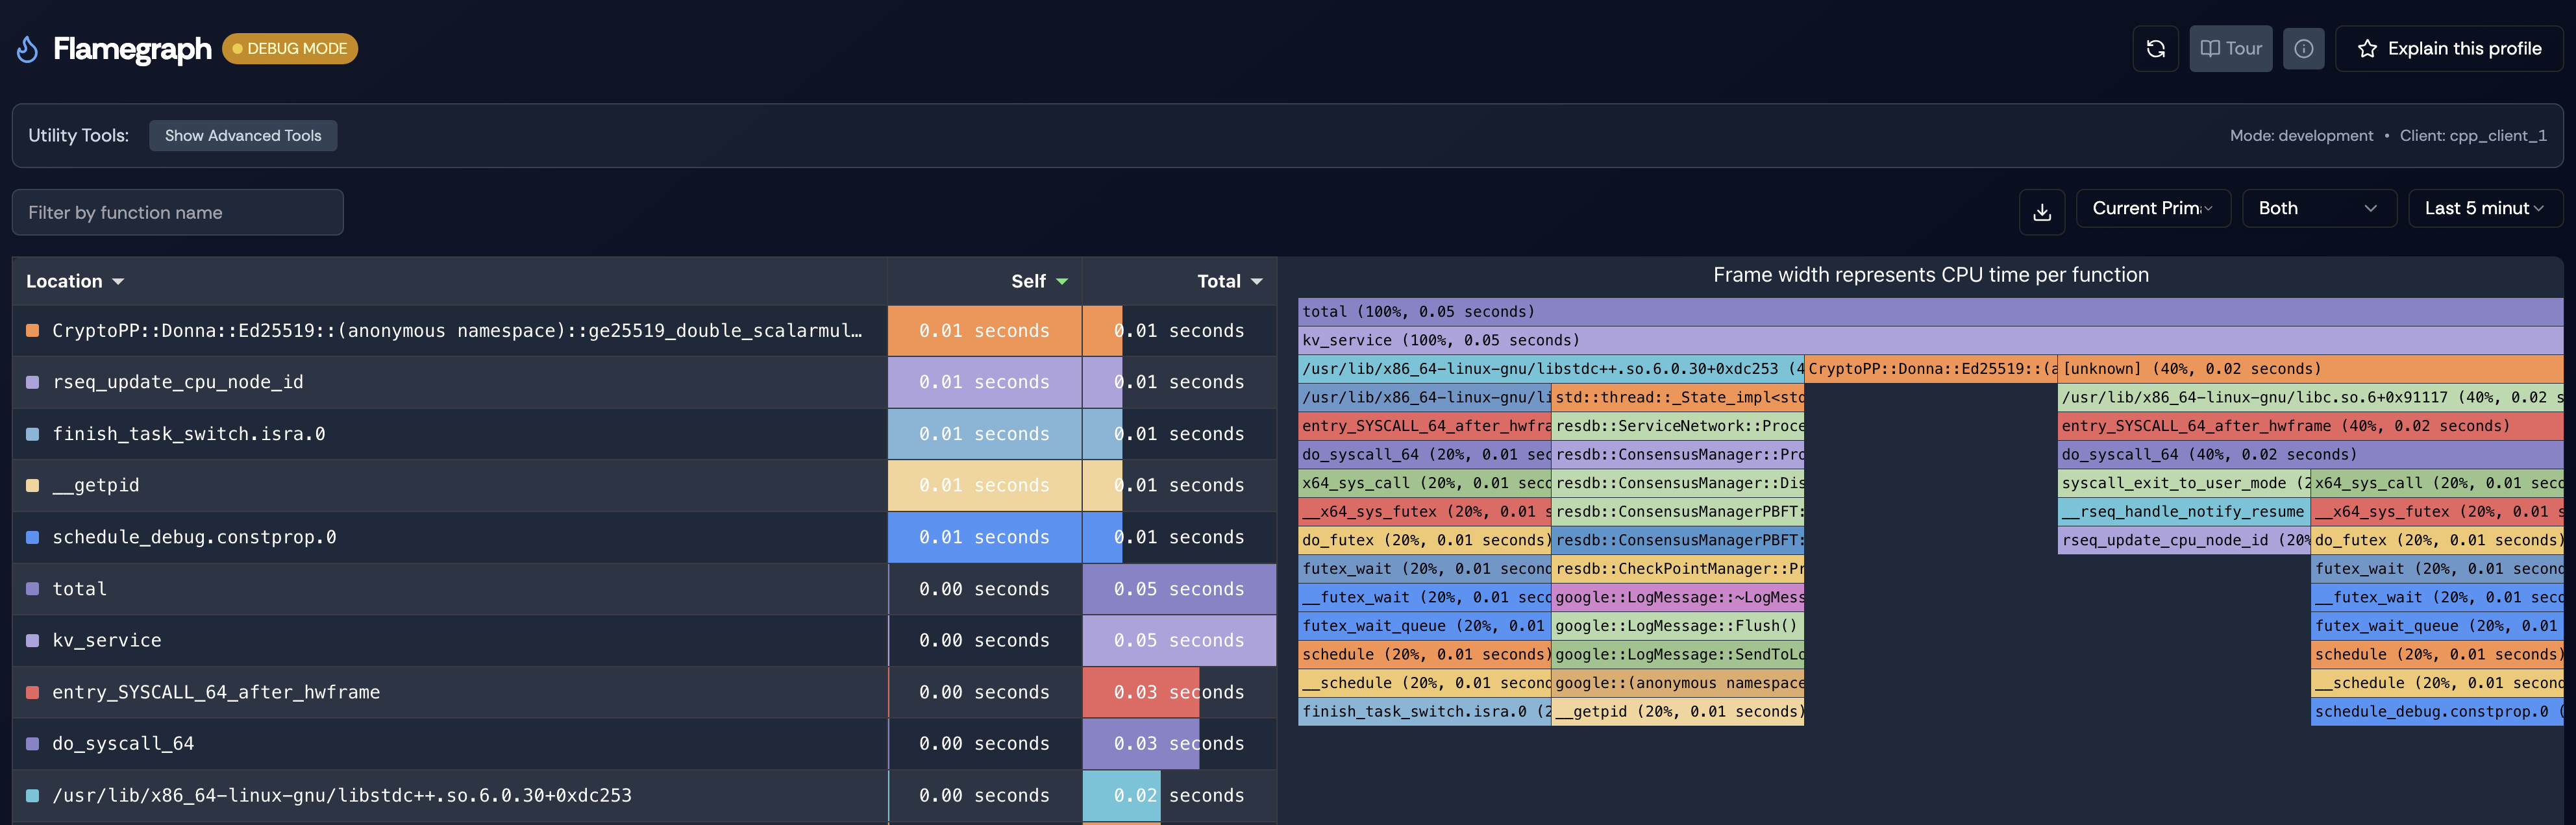
Figure 7. Split view pairing a ranked execution-time table with an interactive flamegraph, where each bar's width reflects CPU time spent in that function.
View in ResLens
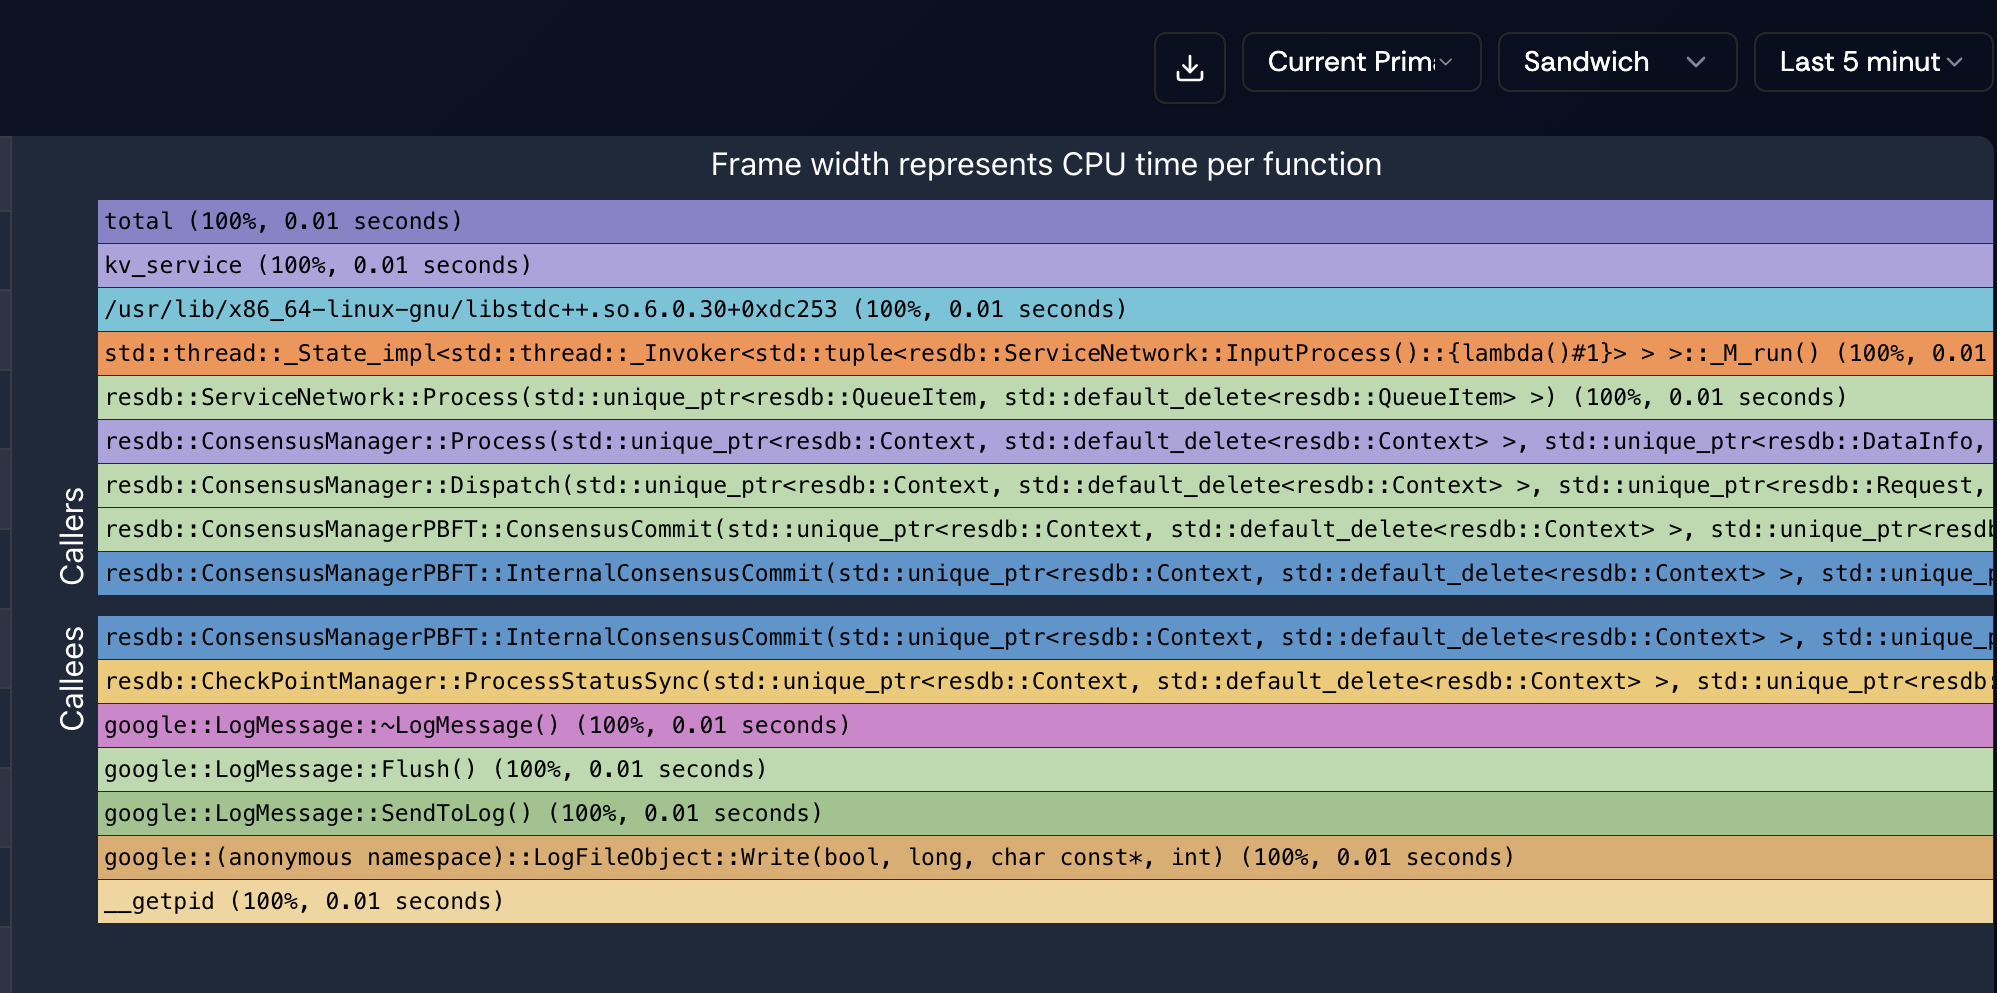
Figure 8. Sandwich view centered on InternalConsensusCommit, with callers above and callees below—useful for tracing which functions a hot path invokes and what invokes it.
View in ResLens
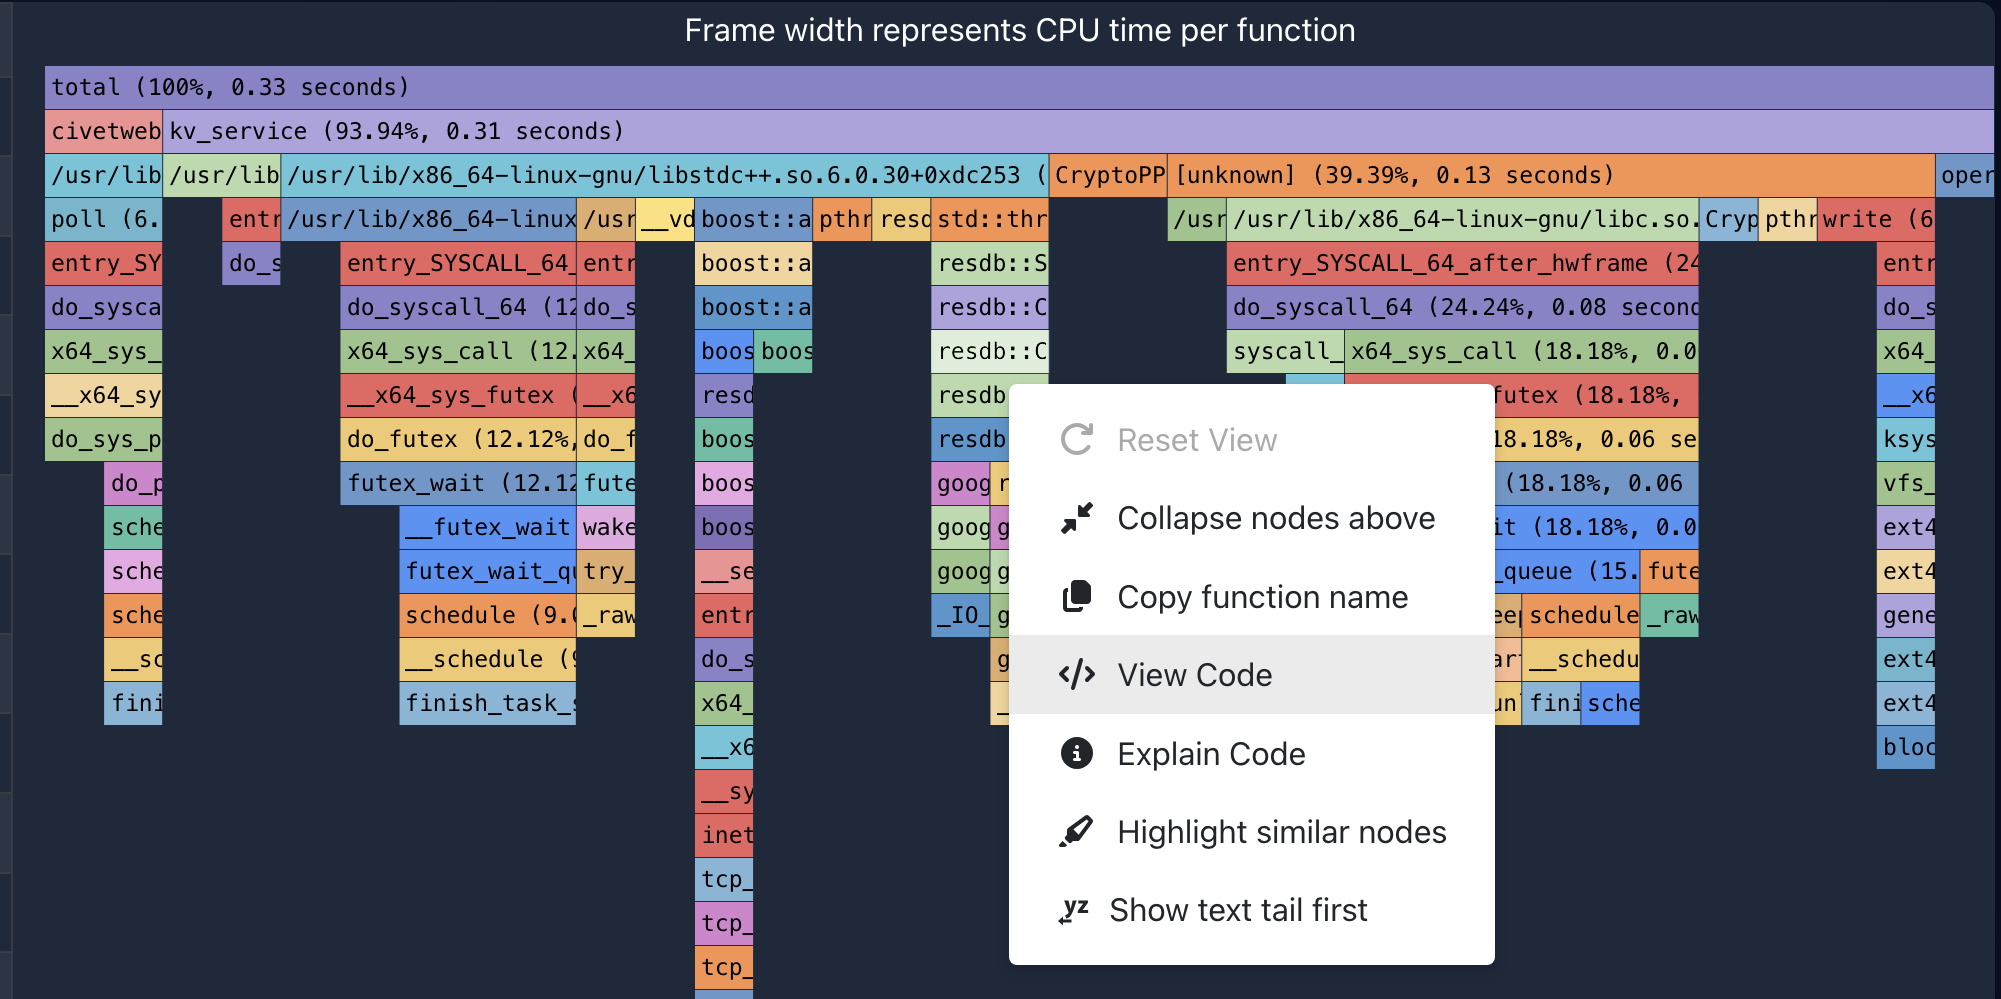
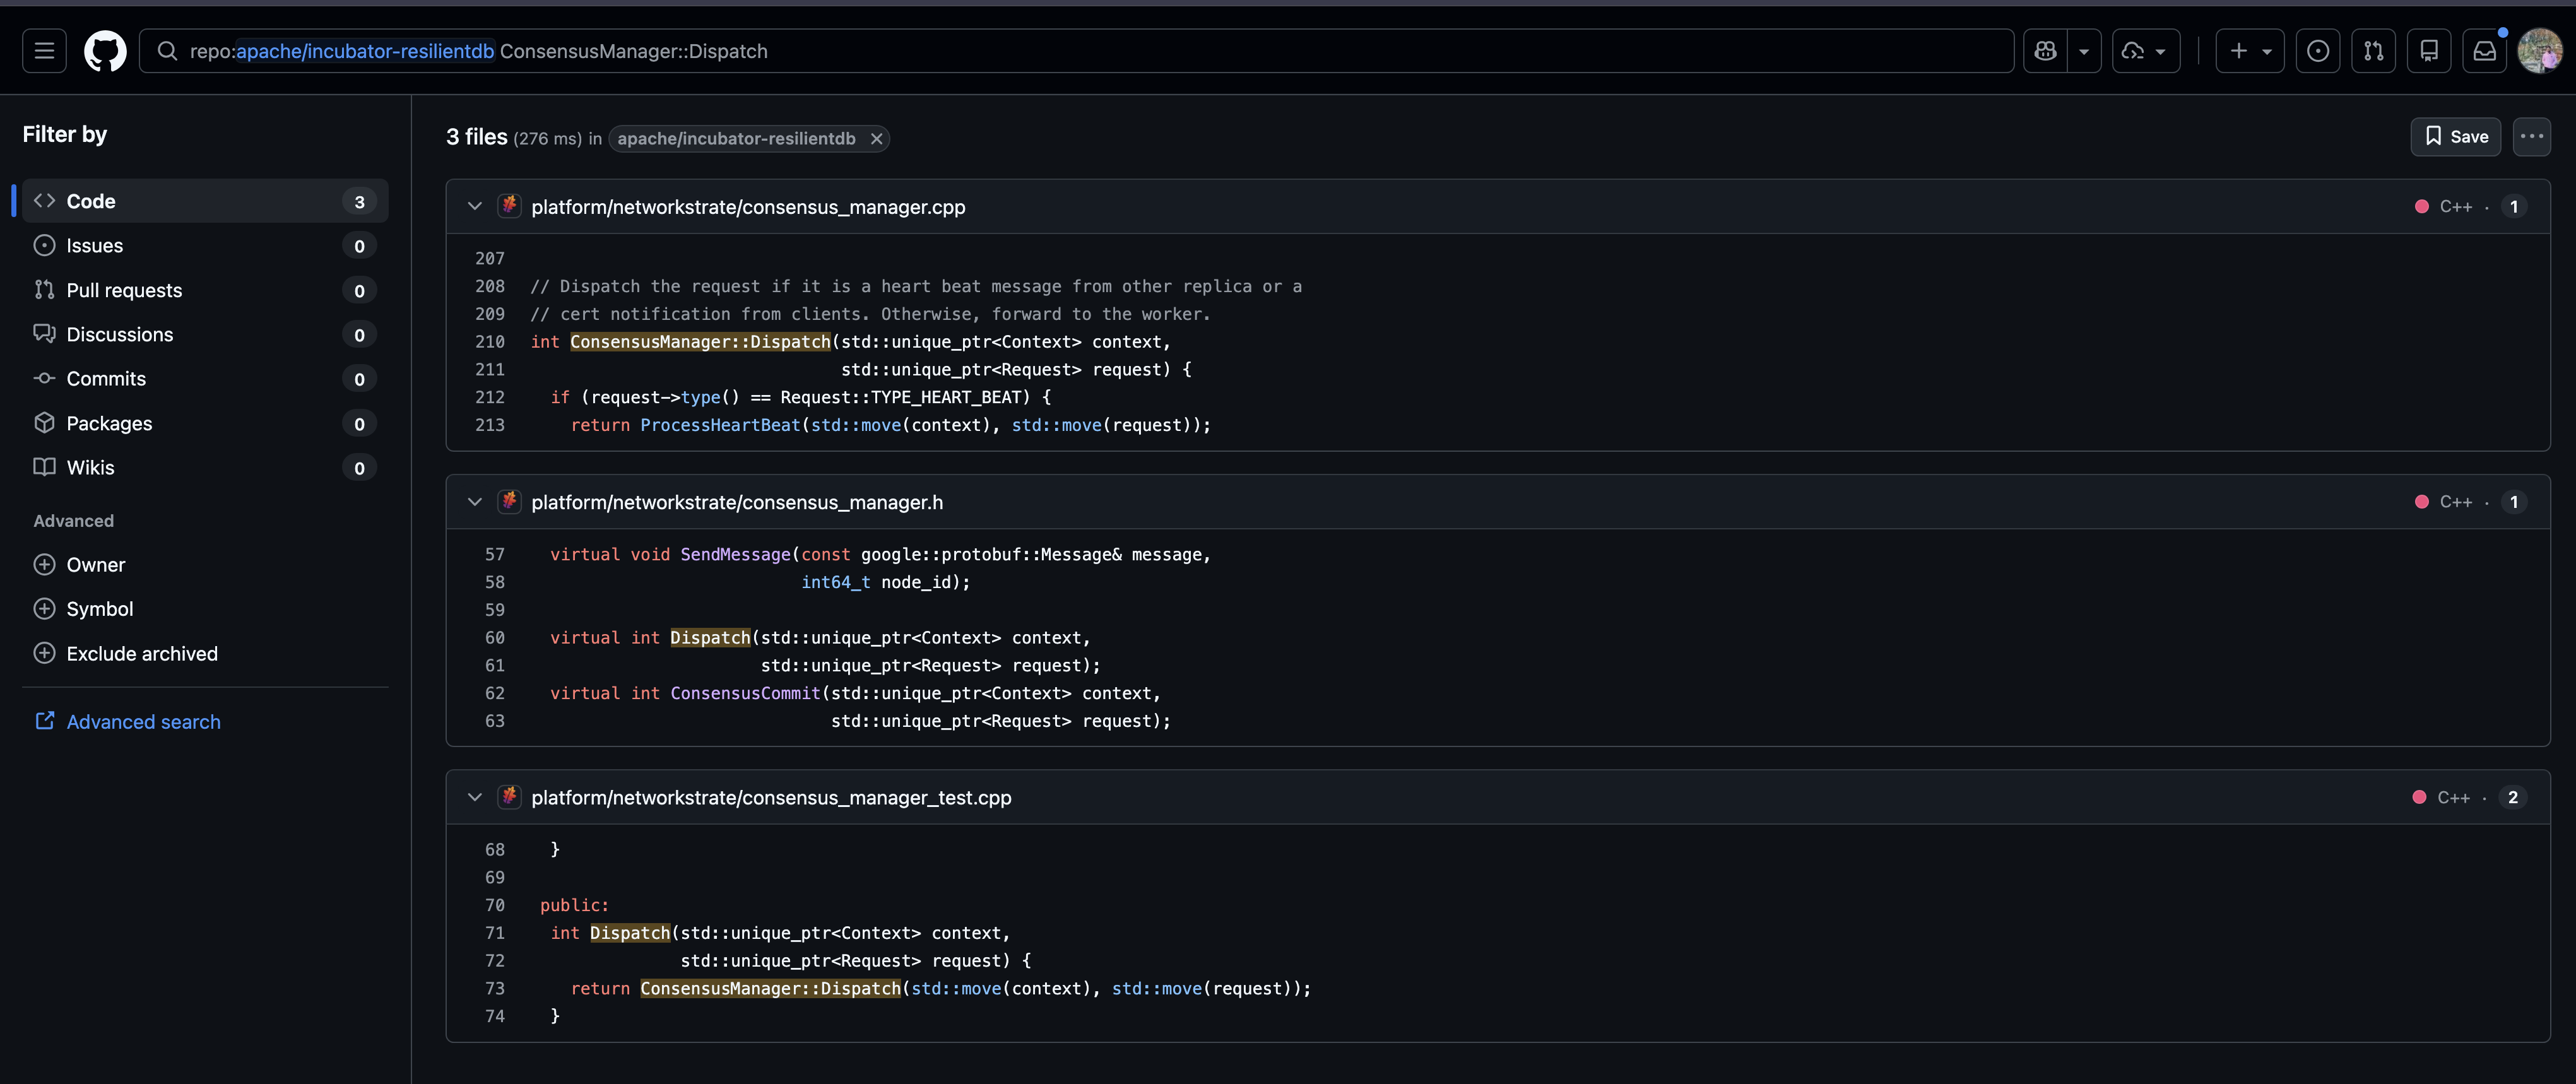
Figure 9. From profile to source code—selecting View Code on a flamegraph span (top) opens a GitHub search for that function's definition in the ResilientDB repository (bottom).
View in ResLens
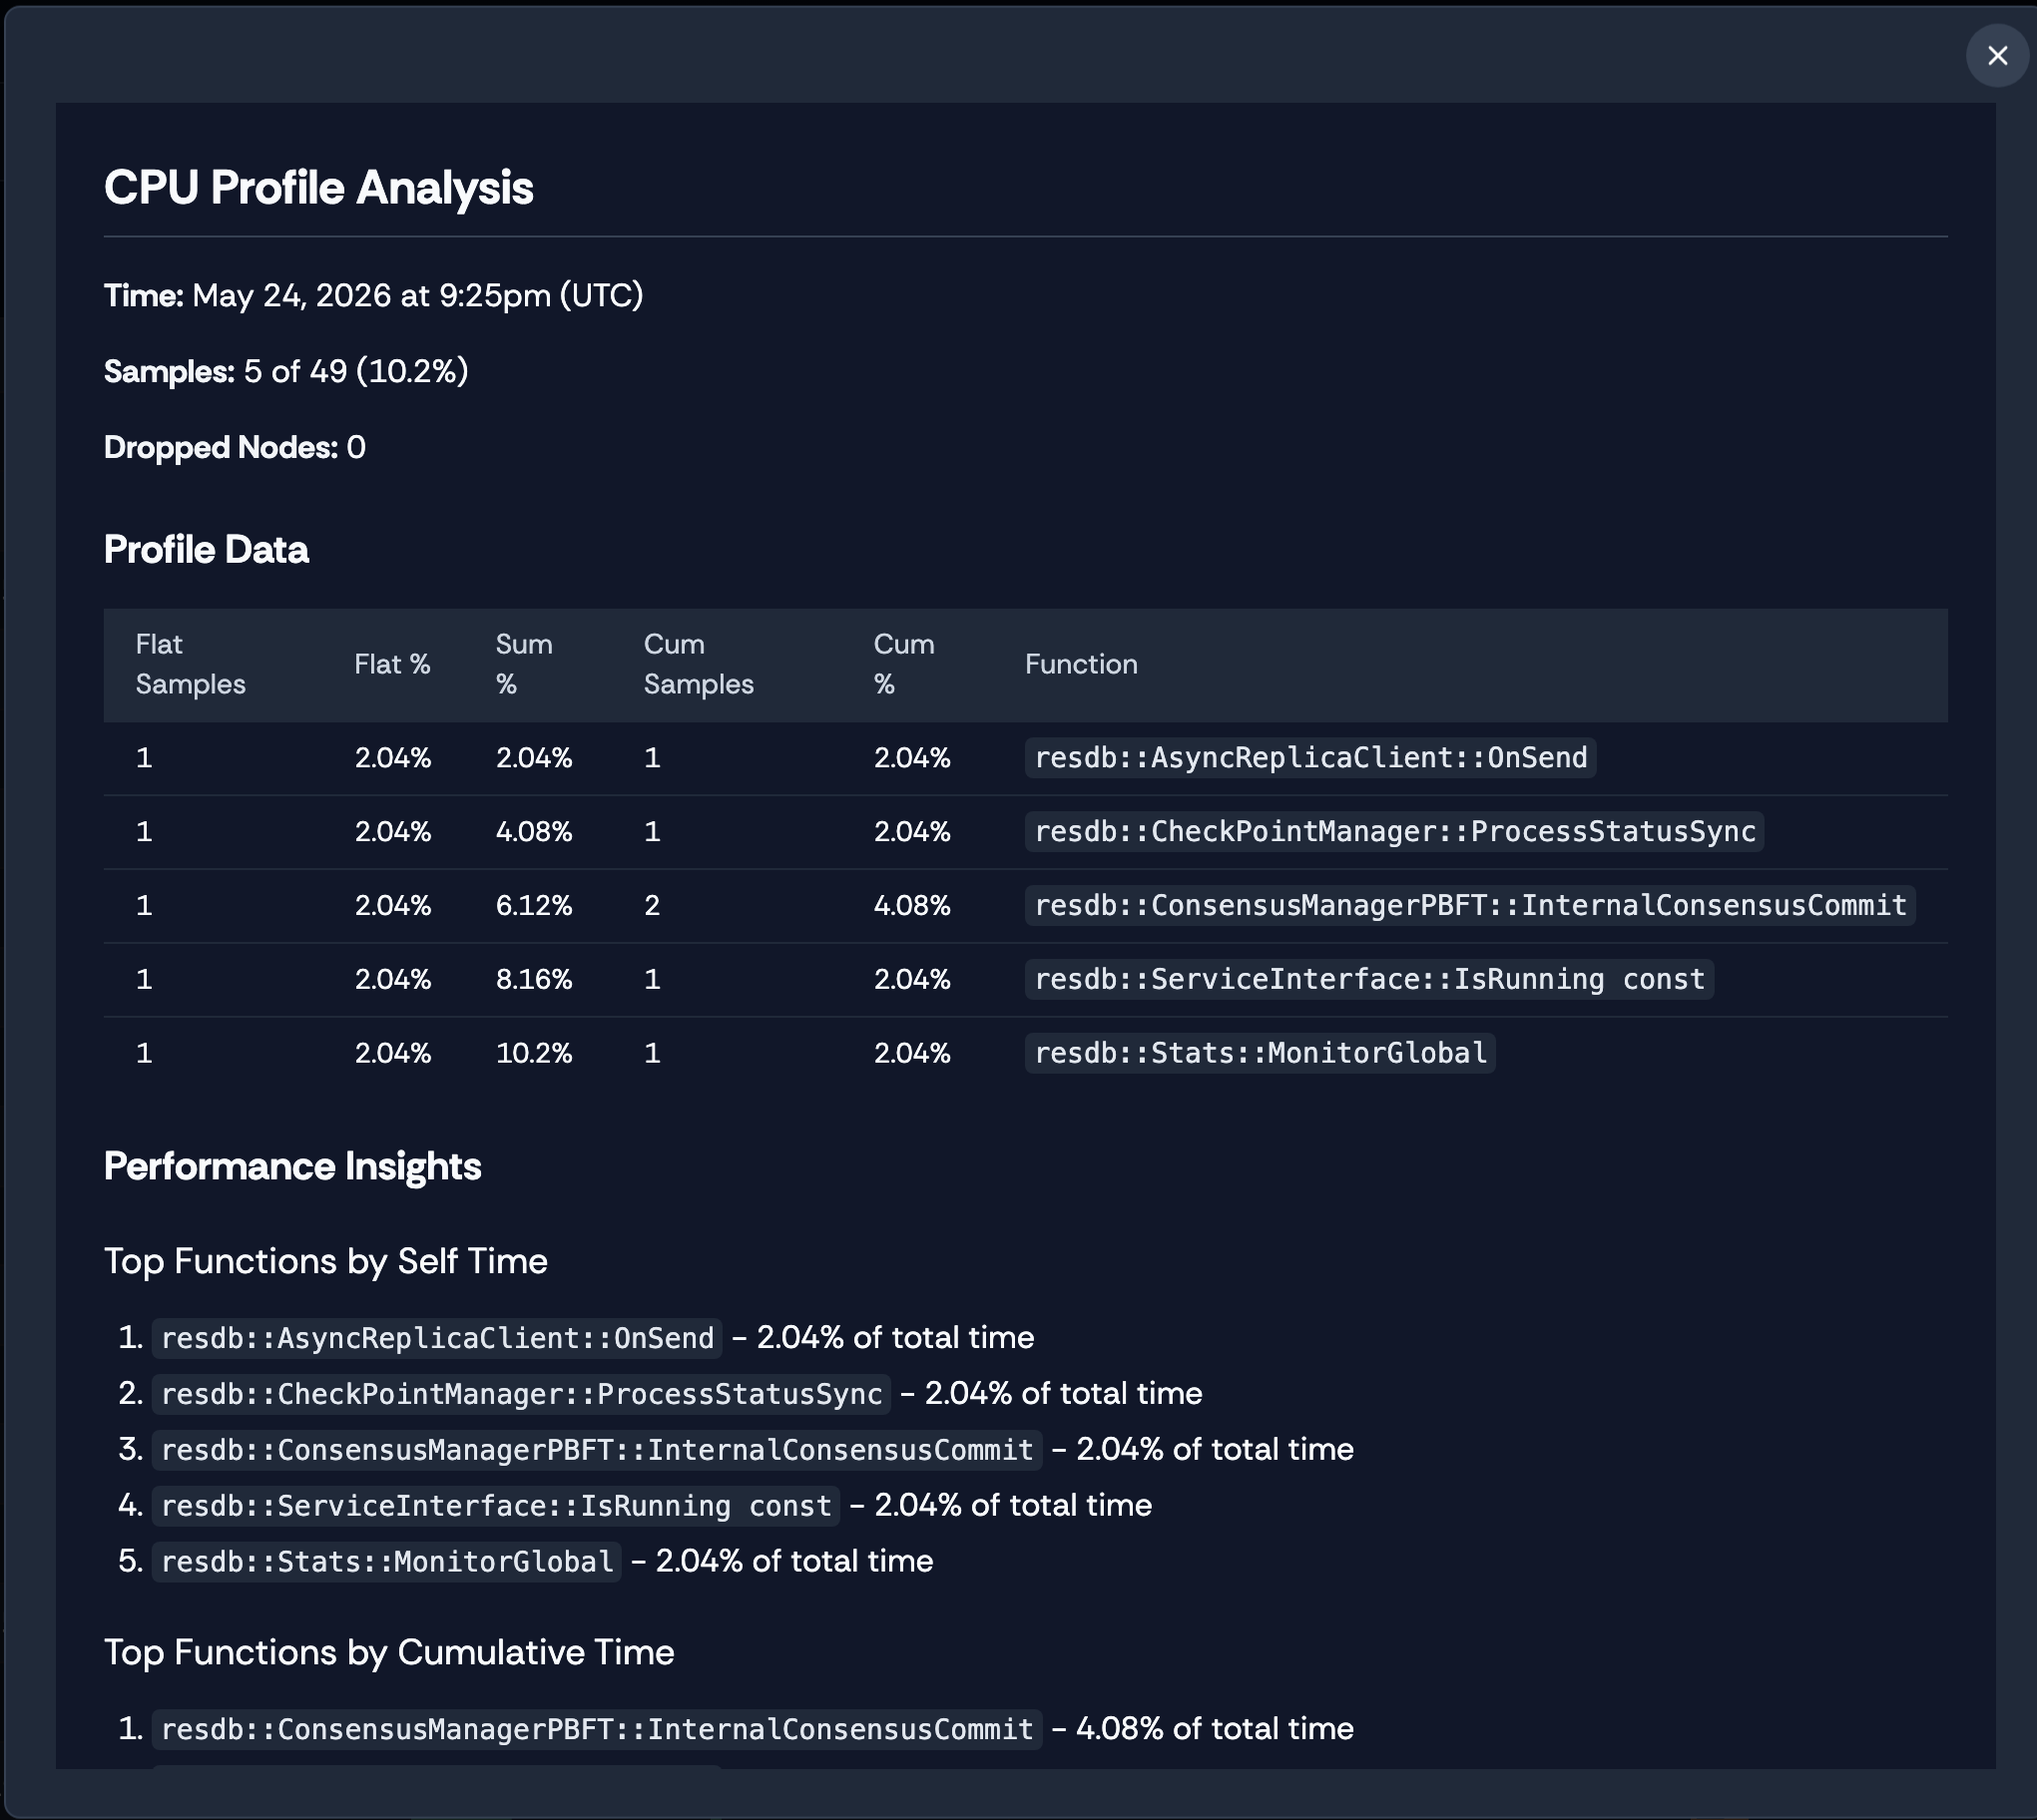
Structured profile summary—flat and cumulative sample percentages per function
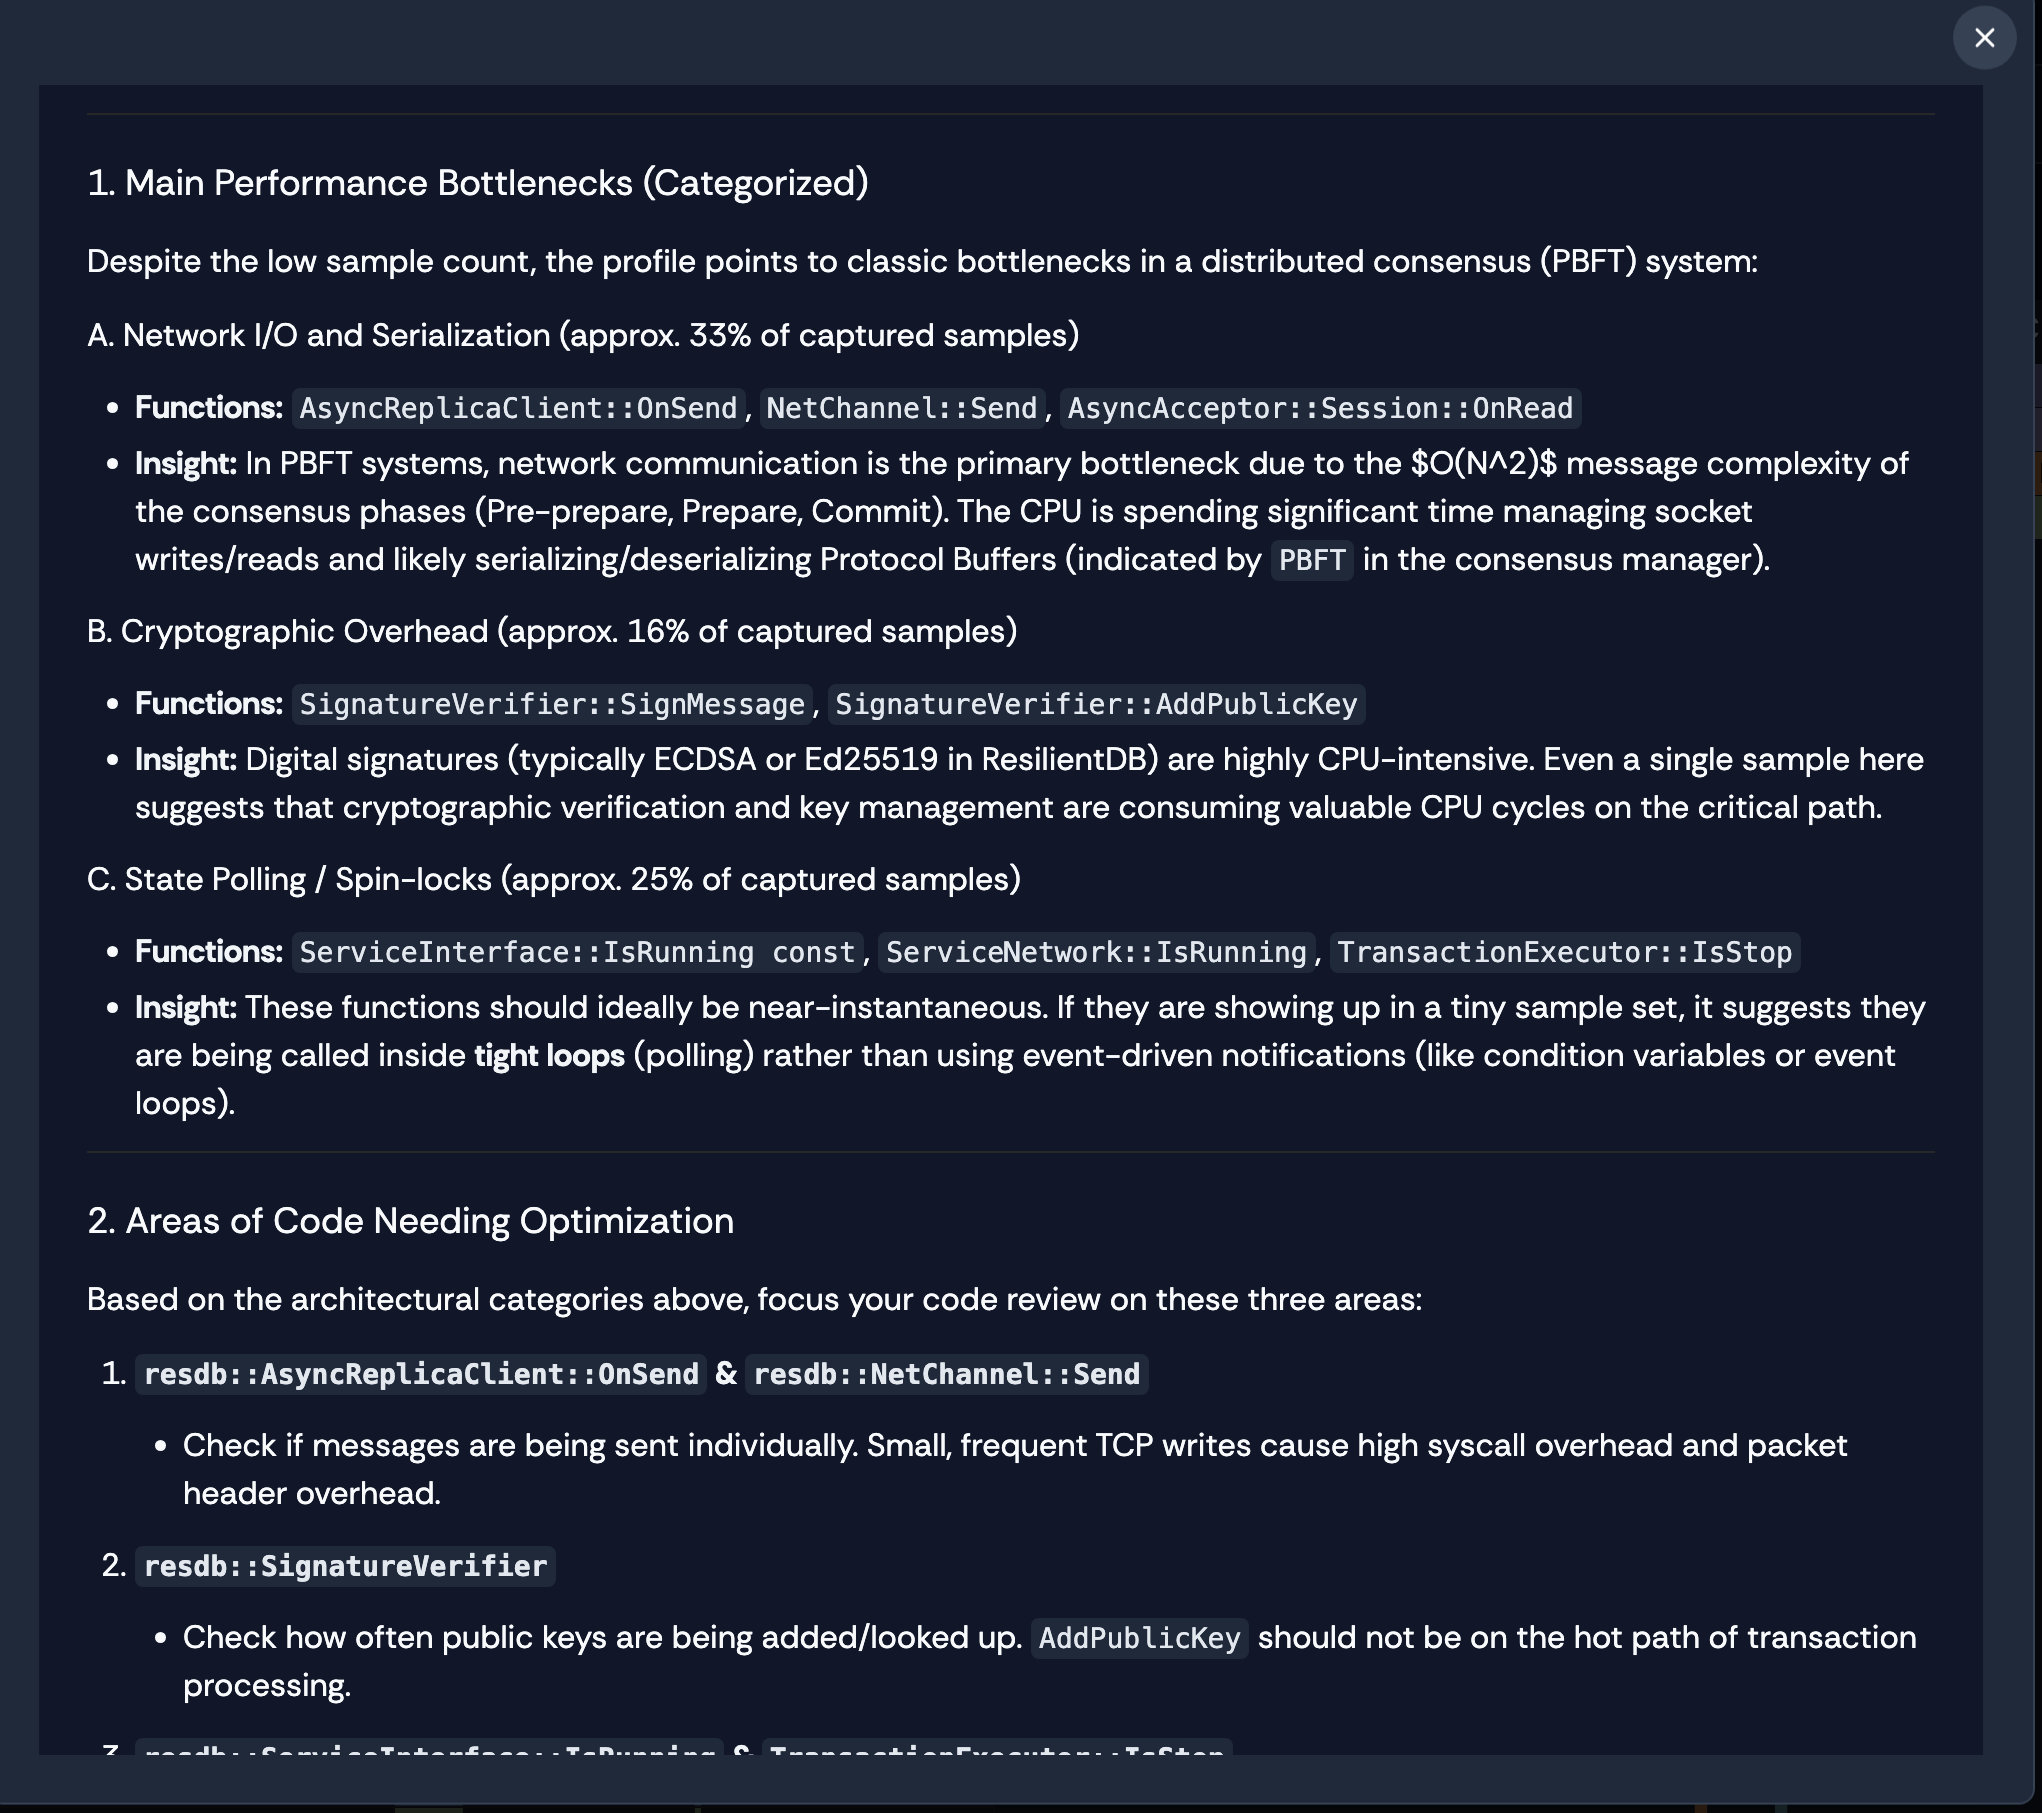
AI-assisted analysis—bottlenecks grouped by network I/O, cryptography, and polling
Figure 10. Two ways to interpret the same CPU profile: a deterministic summary when AI is unavailable (left), and an AI-generated breakdown that categorizes bottlenecks and suggests optimizations (right).
View in ResLens
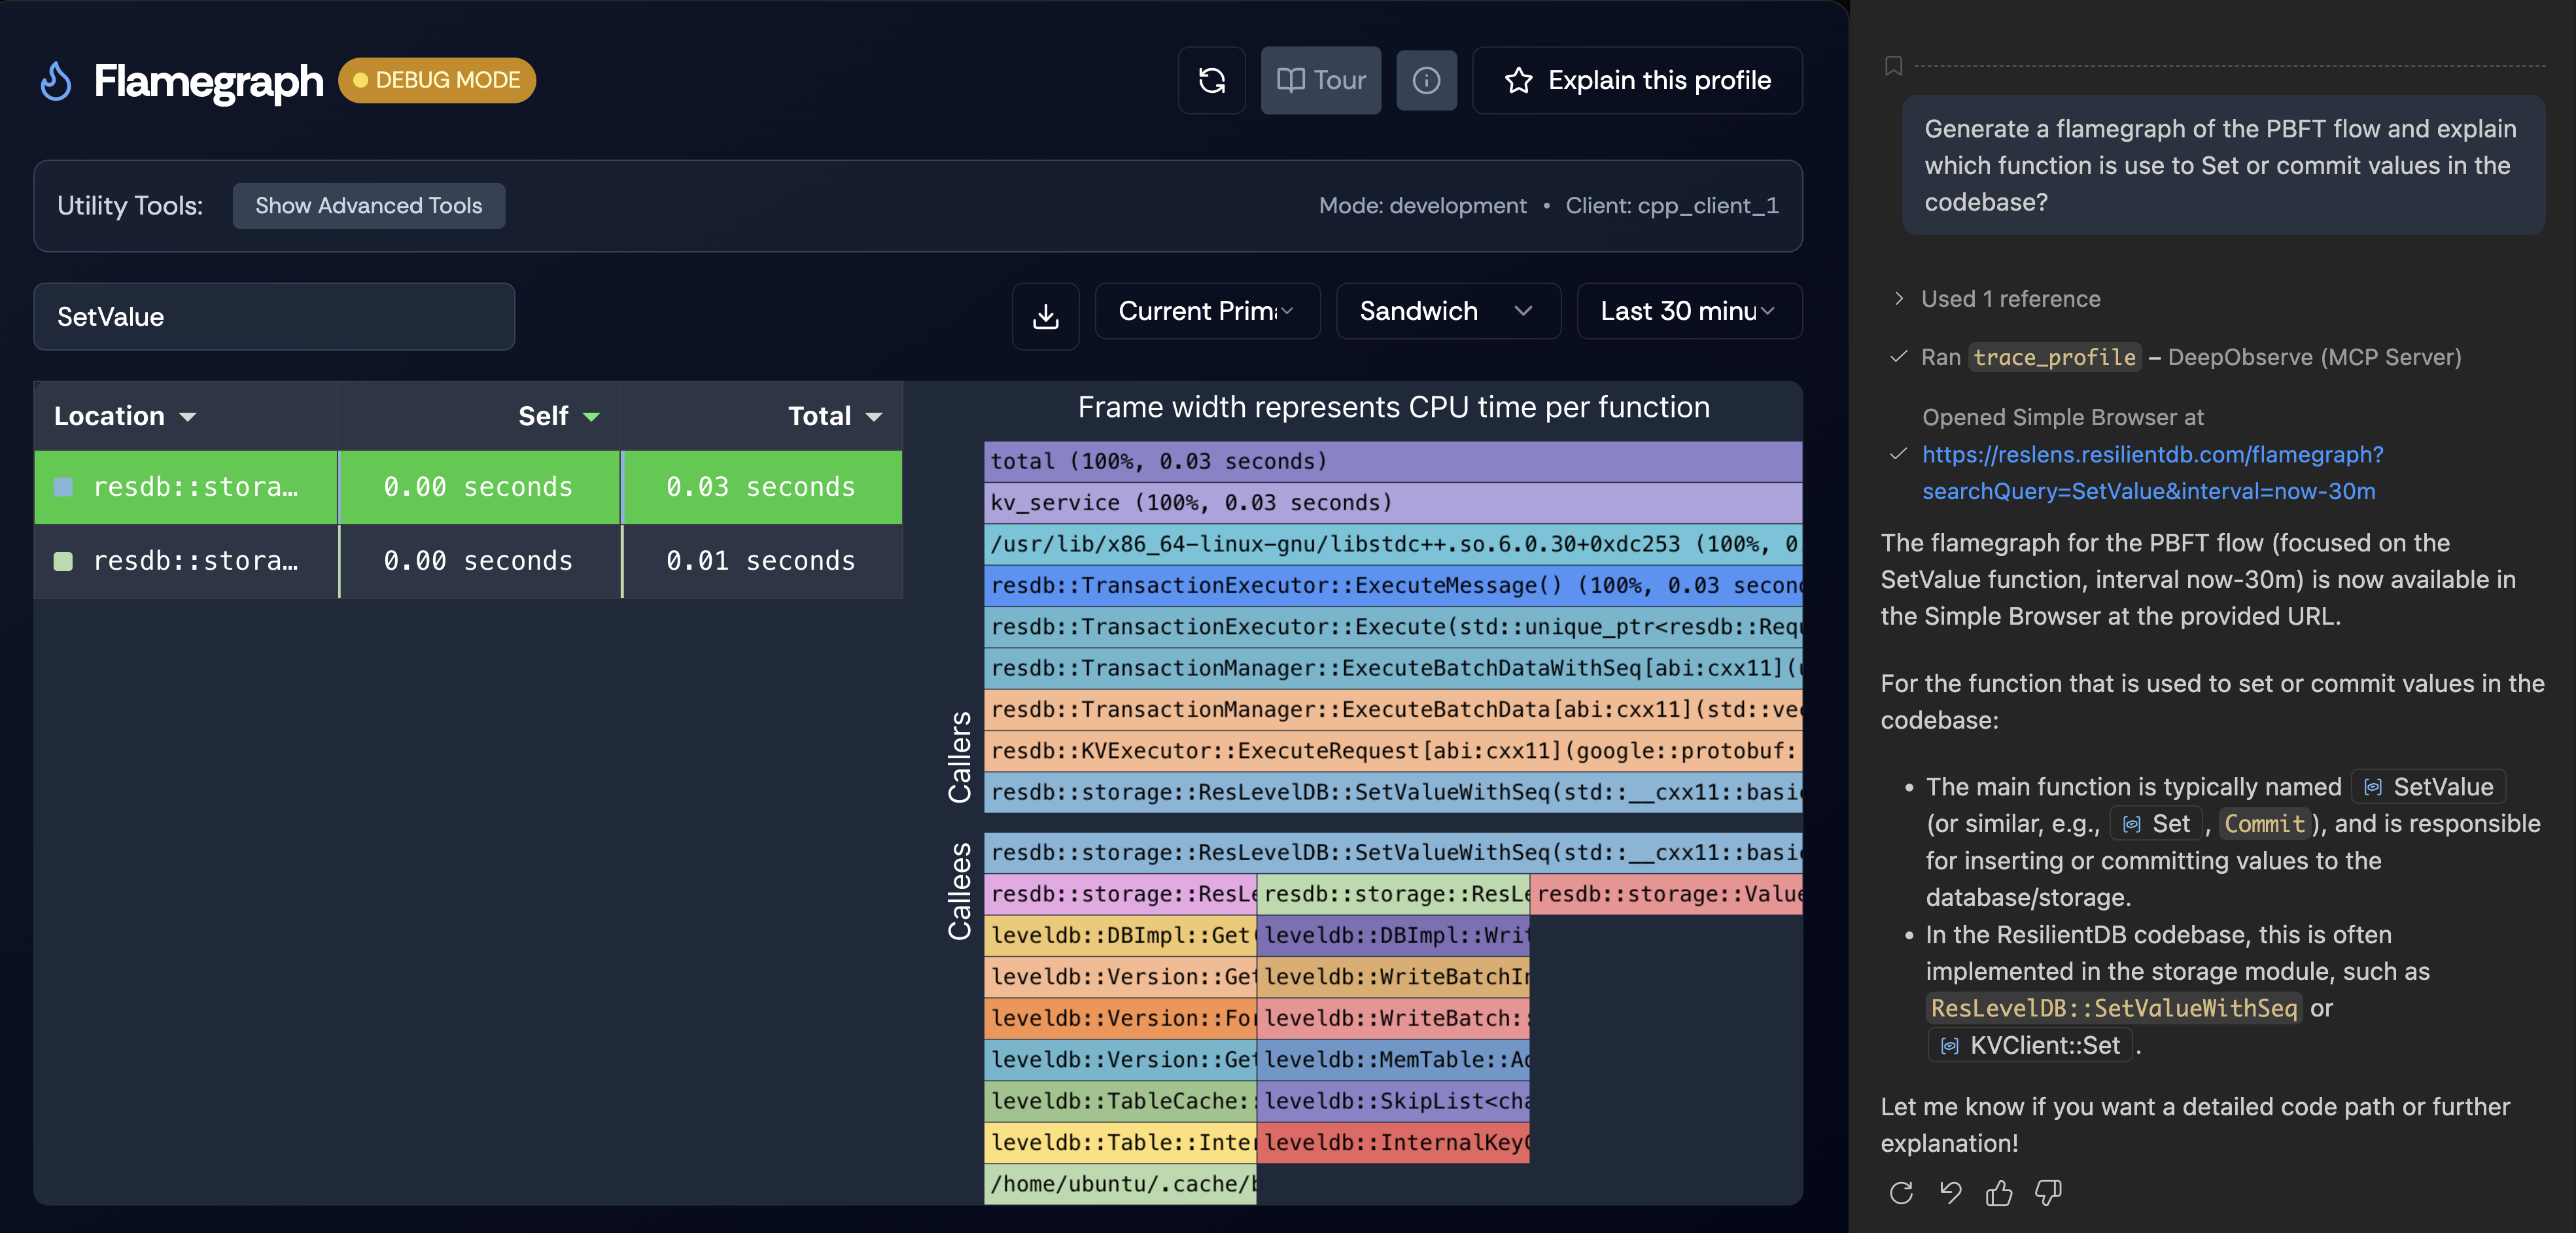
Figure 11. The MCP trace_profile tool opens a web browser and queries the flamegraph to answer user queries—in this case, identifying SetValue as the function used to commit values in the PBFT flow.
View in ResLens
MCP Implementation
AI agents interact with DeepObserve through an MCP server built on FastMCP. Rather than exposing ResView and ResLens as separate endpoints, the server acts as an MCP hub—a single interface that combines database operations, observability UI tools, and proxied integrations with external MCP servers such as Prometheus and Grafana.
The entry point is server.py, which registers three layers of capability:
- Database tools (
src/database/tools.py) —commit_key_valueandget_key_valuesubmit and retrieve transactions against ResilientDB through a REST client, returning structured responses that include the sequence number assigned to each commit. - Observability UI tools — tools such as
trace_requestandtrace_profilereturn MCP UI resources that embed live ResView and ResLens URLs directly in the agent’s chat interface. When an agent callstrace_requestwith a sequence number, the tool constructs a filtered ResView URL and returns it as an embeddable resource—the client opens the visualizer without the user navigating manually. Similarly,trace_profileopens ResLens with query parameters so the agent can inspect flamegraph data while answering performance questions. - Proxied MCP servers (
src/mcp_hub/proxy.py) — external servers for Prometheus and Grafana are mounted with prefixed tool names (e.g.,prometheus_query), giving agents access to metrics and dashboards through the same hub.
This design enables multi-step agent workflows entirely through natural language. An agent can call commit_key_value to insert a transaction, read the returned sequence number, invoke trace_request to open the PBFT visualization for that request, and then call trace_profile to inspect which functions dominated CPU time—all without leaving the conversation. The server runs over SSE transport on port 3500 by default and can be deployed via Docker using the configuration in the repository.
Conclusion
DeepObserve shows that observability for consensus protocols does not require heavy in-process instrumentation or protocol-agnostic trace pipelines. By combining eBPF sidecars with MCP-accessible tooling, ResView and ResLens provide protocol-aware visualization and continuous profiling for ResilientDB—with under 250 lines of lightweight hooks, decoupled sidecar deployment, and an interface that both developers and AI agents can use to understand runtime behavior at the granularity of individual requests and function calls.
The demonstrations in this post cover the full path from motivation to implementation: normal and fault-tolerant PBFT execution, view change sub-protocols, flamegraph analysis across multiple view modes, and agent-driven workflows that commit transactions and immediately visualize the results. Together, these pieces form a practical observability stack for distributed consensus—one that stays out of the hot path while making live protocol behavior legible to humans and machines alike.
Source Code
The DeepObserve MCP server, deployment configuration, and tool implementations are available in the DeepObserve repository. Live demos are available at ResView and ResLens.
Demo Video
Watch the full walkthrough on YouTube.